
Currency
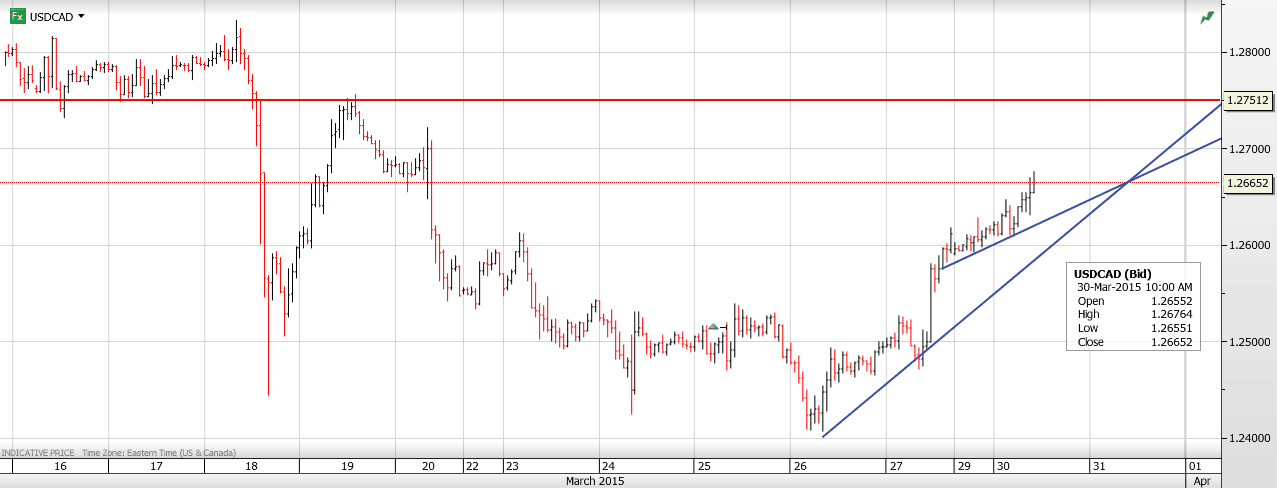
USDCAD Overnight Range 1.2598-1.2670
USDCAD climbed steadily higher overnight and during the early North American session.Falling oil prices are to blame. WTI dipped to $47.70 with expectations that an Iranian nuclear deal could lead to another million barrels per day of crude hitting the market as sanctions get removed. Anticipation of better than expected US data this week, including non-farm payrolls on Good Friday, is also providing the US dollar with support.
Trader’s ignored better than expected Industrial Product Price and Raw Materials Price Index data.US data PCE data was mixed while Pending Home Sales beat forecasts.
It was slippery but thin overnight session with rising nervousness over progress on Greece negotiations weighting on EURUSD in a thinner than usual market due to month-end, quarter-end and Japan year-end. Falling iron ore prices kept downward pressure on AUDUSD and USDJPY firmed in Europe.
USDCAD technical outlook
The intraday USDCAD technicals are bullish while trading above 1.2610 looking for a break of resistance at 1.2670 to extend gains to 1.2820. A move below 1.2610 points to a retest of 1.2550. USDCAD is almost exactly in the middle of the March 1.2410-1.2820 range. For today, USD support is at 1.2610, 1.2580 and 1.2550. Resistance is at 1.2680, 1.2710 and 1.2750
Today’s Range 1.2610-80
Chart: USDCAD 1 hour Larger Chart
![]()

Under the recent information deluge, we haven’t had the time to analyze a very interesting and disturbing trend. The U.S. business inventory to sales ratio has been rising for months. What does it mean for the American economy and the gold market?
According to the Monthly Wholesales Report, inventories were up 6.2 percent in January from a year ago and 0.3 percent from December. Coupled with weak sales data (sales fell by 3.1 percent from December 2014 and 1 percent from January 2014), the inventory to sales ratio increased to 1.35 in January from 1.33 in December 2014. It means that it would take 1.35 months for businesses to clear shelves, the highest inventory-to-sales ratio since July 2009.
Why is data on business inventories so important? The answer is that the changes in the inventory to sales ratio indicate any supply or demand imbalances in the economy. Inventories rise when supply is greater than demand. Inventories rising relative to sales mean that sales fail to meet demand projections. Thus, the inventory to sales ratio usually reaches its cyclical peak in the middle of the recession, when the economy is slowing down. Indeed, please note three things.
First, that inventories of durable goods jumped the most – by 7.7 percent from year ago, which is generally in line with weak data on news orders for durable goods. Second, contrary to the historical declining trend (due to improved inventory management), we are witnessing a gradual rise since 2013 and particularly since the summer of 2014. Actually, the inventory to sales ratio has reached the highest level since the Great Recession (see the chart below). Third, inventories are rising despite low prices. Thus, this indicates week global demand.

The consequences may be significant. The high levels of inventories could make entrepreneurs very
uncomfortable with adding more stocks. Thus, they will probably try to reduce their orders to get inventories in line. However, those orders are the suppliers’ sales. It means that reducing stocks and cutting orders may trigger a spiraling decline in sales and a recession. After Lehman, businesses reduced orders so aggressively that the supply chain seized, sales went down and inventories soared.
To sum up, inventories should not look only at the Fed’s actions and speeches, but also analyze fundamental data. The inventory to sales ratio is of utmost importance, since it shows the supply/demand imbalances. The rising ratio indicates that the U.S. economy is slowing down due to weak demand. The report on U.S. durable goods orders is good news for gold prices, because the possible recession could boost safe-haven demand for gold and change the Fed’s monetary policy stance to even more dovish.
Thank you.
Arkadiusz Sieron
Sunshine Profits‘ Gold News Monitor and Market Overview Editor
Gold News Monitor originally sent to subscribers on March 30, 2015, 7:00 AM.

Strengths
- Deutsche Bank said that after seven consecutive days of gains in the gold market, it has become increasingly difficult to dismiss the rally as merely a function of the recent weakness in the U.S. dollar. Additionally, Saudi Arabia-led bombings in Yemen this week boosted demand for safe-haven assets. The Saudi government pledged to continue the strikes against Shiite rebels to prop up the allied government.
- Bank of America believes the euro/dollar squeeze is not over, meaning the dollar should continue to correct lower. Given this outlook, BofA recommended buying any dips in the gold price and set a target of $1,307 per ounce.
- Shanghai Gold Exchange withdrawal volume through March 13 was 51.5 metric tons (mt). If this pace continues, withdrawals this year would exceed last year’s 2,102 mt.
Weaknesses
- JPMorgan Chase, Barclays, Goldman Sachs, HSBC, Bank of Nova Scotia, SocGen and UBS will be the participant banks in setting the LBMA Gold Price benchmark. Several of these banks have been involved in commodities price-fixing scandals. China, now a major player in the global gold trade, was not granted representation. Commentators have speculated that had Chinese banks been included, there would be less room for manipulation.
- Reports have been circulated speculating that Nevsun’s Bisha mine had been bombed by the Ethiopian Air Force, in retaliation to an Ethiopian helicopter being held by Eritrea, earlier in the week. So far Nevsun has only reported an “act of vandalism” at the mine which caused no significant damage, affecting only the base of a tailings thickener.
- Platinum non-commercial Nymex shorts have more than doubled since the beginning of February and last week rose another 13.2 percent to their fourth successive all-time high. Several factors have weighed on the metal recently including an ongoing weak demand outlook due to constrained diesel auto catalyst consumption in Europe, poor jewelry demand for platinum in China, and South African supply recovering much more quickly than expected after last year’s five-month-long strikes.
Opportunities
- HSBC analysts, some of the earliest adopters of a bullish view on the U.S. dollar back in 2013, now believe the dollar rally may be at or nearing its end. The analysts point out that past dollar rallies of this type have mostly seen a dollar appreciation of around 20 percent and lasted from under a year, meaning the current rally is already extended. Furthermore, they pointed out that disappointing U.S. economic data is mounting and being largely ignored. Valuations suggest that the U.S. dollar may now be the world’s most overvalued currency, only being overshadowed by the strength in the Swiss franc since its tie to the euro was cut.
- The Philadelphia Gold and Silver Index, made up of the largest gold stocks, is at around a 73 percent discount to the bullion price, with the index more than 60 percent lower than the start of 2008. Gold, on the other hand, is still more than 40 percent higher. The index’s total price/cash flow has almost halved from 2008, to around 7.5x from 14.3x even though it is expected to post its first positive operating income this year since 2012.
- TD Securities published a precious metals outlook in which the firm questions the sustainability of the supply/demand balance in the gold market due to declining reserves. 2014 marked the third straight year of reserve declines, with exploration spending being reduced as miners focused on capital preservation. Total reserves for the large-cap producers are down around 24 percent from the 2011 peak. The decline highlights that existing exploration budgets are not sufficient to keep pace with current mining depletion. In contrast, Integra Gold announced it recently intersected 14.8 grams per tonne (g/t) gold over 10 meters and 11.5 g/t gold over 8 meters in a step-out drilling up to 330 meters from triangle. Discoveries like Integra could make it of interest as a takeover target.
Threats
- Analysts at SocGen published a report in which they forecast that the gold price, having given away all its early year gains, is headed sharply lower, as they see a continuation in the dollar’s strength. They see the price of gold falling to an average of $925 per ounce between 2016 and 2019. The timing of the report was perhaps unfortunate in that it predated the events of the past few days, which has seen the reverse, occur.
- CPM Group sees gold falling for a third straight year in 2015 as concern eases that global economies will falter, curbing demand for the metal as a haven. CPM Group forecast gold will average $1,208 per ounce in 2015.

- Under the auspices of fighting terrorism, France’s Minister of Finance has rolled out a series of eight new restrictions aimed specifically at minimizing the use of cash. In reality, these are capital controls designed to keep individuals’ savings trapped in the banking system. Many banks in Europe have already dropped their deposit rates into negative territory and as interest rates become even more negative, more people will realize that they’re better off holding physical cash instead of paying their banker to hold it for them.
It’s been a lousy year so far for US stocks.
The S&P 500 is as flat as a pancake year to date.
But if investors are worried, it’s not showing up in the so-called “fear index,” the CBOE Volatility Index (VIX).
The VIX tracks the options market’s expectation for volatility (aka price swings) in the S&P 500 over the next 30 days.
In the dark days of 2008, the VIX spiked to above 80 points. As a rule of thumb, when the VIX is above 30, it tells you that investors see a lot of volatility ahead in stocks, as a result of fear or uncertainty. When the VIX is below 20, it tells you investors are less worried – and even complacent – about the future.
As you can see below, right now complacency is the name of the game.

So far this year, the VIX has barely broken a sweat, never rising above 23.
But just because most investors are complacent doesn’t mean you should be.
Ed Note: Here is the long term chart of the VXX (iiPath S&P 500 VIX ST Futures ETN – VXX)


(1) Surge Energy Inc. (TSE:SGY.CA) — 9.7% YIELD
Surge Energy is an oil and natural gas company engaged in the exploration, development and production of petroleum and natural gas reserves in Western Canada. As of Dec 31 2010, Co.’s total net proved reserves for light and medium crude oil, heavy crude oil, natural gas liquids and natural gas were 3,760,100 barrels, 2,418,200 barrels, 570,900 barrels and 31,031,000,000 cubic feet, respectively.

![]()

-
I know Mike is a very solid investor and respect his opinions very much. So if he says pay attention to this or that - I will.
~ Dale G.
-
I've started managing my own investments so view Michael's site as a one-stop shop from which to get information and perspectives.
~ Dave E.
-
Michael offers easy reading, honest, common sense information that anyone can use in a practical manner.
~ der_al.
-
A sane voice in a scrambled investment world.
~ Ed R.
Inside Edge Pro Contributors

Greg Weldon

Josef Schachter

Tyler Bollhorn

Ryan Irvine

Paul Beattie

Martin Straith

Patrick Ceresna

Mark Leibovit

James Thorne

Victor Adair