
Currency
Forex Trading Alert originally published on Apr 16, 2015, 10:39 AM
Yesterday, the Bank of Canada left its monetary policy unchanged (the overnight cash rate at 0.75%), which in combination with a sharp increase in crude oil pushed the Canadian dollar higher against its U.S. counterpart. As a result, USD/CAD broke below important support levels, confirming a bearish formation. How low could the exchange rate go?
In our opinion, the following forex trading positions are justified – summary:
EUR/USD: none
GBP/USD: none
USD/JPY: none
USD/CAD: short (stop loss order at 1.2876)
USD/CHF: none
AUD/USD: none
EUR/USD
The medium-term picture hasn’t changed much as EUR/USD is still trading in a narrow range between the lower border of the declining trend channel and the long-term resistance line, which means that as long as there is no breakout/breakdown, a sizable upward/downward move is not likely to be seen.
Will the daily chart give us clues about future moves? Let’s check. 
Quoting our previous Forex Trading Alert:
(…) the pair invalidated the breakdown under the upper border of the blue declining trend channel and the lower line of the consolidation, which is a positive sign. Additionally, buy signals generated by the indicators remain in place, supporting further improvement.
Yesterday, EUR/USD moved lower and verified the above-mentioned breakout, which was a positive sign that triggered a rebound. Although the pair moved lower earlier today, the exchange rate is still trading above the upper border of the blue declining trend channel (and buy signals remain in place), which suggests another attempt to move higher in the coming days (even if EUR/USD tests its nearest support once again). If this is the case, the initial from our last commentary will be in play:
If (…) the exchange rate moves higher from here, the initial upside target would be the previously-broken orange resistance line (currently around 1.0854).
Very short-term outlook: mixed
Short-term outlook: mixed
MT outlook: mixed
LT outlook: mixed
Trading position (short-term; our opinion): No positions are justified from the risk/reward perspective at the moment.
USD/JPY
The medium-term outlook remains mixed as USD/JPY is still trading in a consolidation (between the Dec high and low) around the 61.8% Fibonacci retracement level (based on the entire 1998-2011 declines). Today, we’ll focus on the very short-term changes.

On Tuesday, we wrote the following:
(…) the green line is still in play and keeps gains in check. Taking this fact into account, and combining it with sell signals generated by the CCI and Stochastic Oscillator, we think that further deterioration is just around the corner. If this is the case, and USD/JPY moves lower from here, the initial downside target would be the previously-broken red declining support line (currently around 119.36). If it is broken, we might see a decline even to 118.71-118.85, where the bottom of the previous pullback is.
Looking at the daily chart, we see that the situation developed in line with above scenario and USD/JPY reached our downside target. Earlier today, the green support zone triggered a rebound, which took the exchange rate above the declining red line. Despite this improvement, sell signals generated by the indicators remain in place, supporting the bearish case. Therefore, in our opinion, today’s increase will be more reliable if we see a daily close above the resistance line.
Very short-term outlook: mixed
Short-term outlook: mixed
MT outlook: mixed
LT outlook: bullish
Trading position (short-term; our opinion): No positions are justified from the risk/reward perspective at the moment.
USD/CAD

In our yesterday’s commentary we wrote:
(…) when we take a closer look at the chart we can see a potential head and shoulders formation. Therefore, if USD/CAD declines below the neck line (the blue support line around 1.2428), it would be a bearish signal, which will likely trigger further deterioration.
As you see on the weekly chart, USD/CAD moved sharply lower and broke below the neck line, which suggests further correction and a drop to around 1.2000, where the size of the downward move will correspond to the height of the formation and where the 38.2% Fibonacci retracement level is.
Are there any short-term support levels that could hinder the realization of the above scenario? Let’s examine the daily chart and find out.

Quoting our last Forex Trading Alert:
(…) the exchange reversed and declined not only below the blue line, but also under the green support line, which suggests further deterioration and another test of the green support zone or even a drop to the lower border of the declining trend channel (currently around 1.2326) in the coming day(s). Please note that this scenario is also reinforced by the sell signal generated by the Stochastic Oscillator at the moment.
On the above chart we see that currency bears pushed USD/CAD lower as we expected. With this downswing the exchange rate broke not only below the green support zone, but also under the lower border of the declining trend channel. Taking the above into account, and combining it with sell signals generated by the indicators and the medium-term picture, we think that further deterioration s more likely than not. Please note that the pair verified yesterday’s breakdown earlier today, which is an additional negative signal. Therefore, in our opinion, the initial downside target for currency bears would be around 1.2040, where the size of the downward move will correspond to the height of the consolidation (on Tuesday, the pair broke below the lower line of the formation, triggering a bearish scenario).
Before we summarize today’s alert we would like to draw your attention to the relationship between the exchange rate and the oil market. The reason? In January, the Bank of Canada surprised markets with an unexpected rate cut, which was “insurance” (in the words of the Governor Stephen Poloz) against the effects of lower oil prices. Meanwhile, since the beginning of the month, the commodity gained almost 18%, which was supportive for the Canadian dollar (in this period of time USD/CAD lost 3%). Therefore, we think that the pair’s further moves will continue to strongly linked to the price of crude oil (if you want to keep up with the changes taking place every day and receive trading signals, we encourage you to read our daily Oil Trading Alerts).
Very short-term outlook: bearish
Short-term outlook: bearish
MT outlook: bearish
LT outlook: mixed
Trading position (short-term; our opinion): Short positions (which are already profitable) with a stop loss order at 1.2876 are still justified from the risk/reward perspective. We will keep you informed should anything change, or should we see a confirmation/invalidation of the above.
Thank you.
Nadia Simmons
Forex & Oil Trading Strategist
Przemyslaw Radomski
Founder, Editor-in-chief
Sunshine Profits: Gold Investment & Silver Investment
Sunshine Profits: Forex Trading
* * * * *
Disclaimer
All essays, research and information found above represent analyses and opinions of Nadia Simmons and Przemyslaw Radomski, CFA and Sunshine Profits’ associates only. As such, it may prove wrong and be a subject to change without notice. Opinions and analyses were based on data available to authors of respective essays at the time of writing. Although the information provided above is based on careful research and sources that are believed to be accurate, Nadia Simmons, Przemyslaw Radomski, CFA and their associates do not guarantee the accuracy or thoroughness of the data or information reported. The opinions published above are neither an offer nor a recommendation to purchase or sell any securities. Nadia Simmons and Przemyslaw Radomski, CFA are not Registered Securities Advisors. By reading Nadia Simmons’s and Przemyslaw Radomski’s, CFA reports you fully agree that they will not be held responsible or liable for any decisions you make regarding any information provided in these reports. Investing, trading and speculation in any financial markets may involve high risk of loss. Nadia Simmons, Przemyslaw Radomski, CFA, Sunshine Profits’ employees and affiliates as well as members of their families may have a short or long position in any securities, including those mentioned in any of the reports or essays, and may make additional purchases and/or sales of those securities without notice.

USDCAD Overnight Range 1.2223-1.2323
The US dollar is Mr.Toad and it has been on a wild ride this morning. Another bout of weak US economic data (Jobless Claims rose, Housing Starts and Building Permits fell) revered hard won US dollar gains in Europe. USDCAD which had scraped back above 1.2310 prior to the data plunged and is now 1.2228, below the overnight low. The break of major support at 1.2330 combined with a re-evaluation of the Canadian economic landscape and the prospect of higher oil prices have triggered a wholesale bail-out of stale Long USDCAD positions.
The overnight session was entertaining. AUDUSD took over where Canada left off in a lively Asian session. Short AUDUSD traders scrambled to cover positions when Australia announced a whopping 37,700 jobs increase and a drop in the unemployment rate to 6.1% from 6.3% and AUDUSD soared. Kiwi followed AUDUSD higher. USDJPY traders saw the carnage in AUDUSD and USDCAD and sold dollars as well. In Europe, EURUSD traders bought dollars and then reversed course just ahead of the New York opening. The US dollar has been offered ever since.
USDCAD technical outlook
The intraday USDCAD technicals are bearish while trading below 1.2270 with the break of the overnight low at 1.2257 pointing to further losses toward 1.2050. Only a move back above 1.2360 would negate the short term downside pressure. For today, USDCAD support is at 1.2220 and 1.2180. Resistance is at 1.2280 and 1.2310
Today’s Range


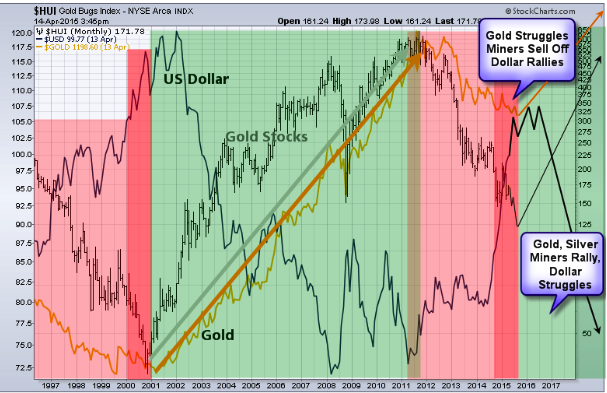
Recently business and financial guru Mark Cuban wrote an article about why this tech bubble is going to be worse than the tech bubble of 2000. This made me take another look at the long term charts again, but instead of looking up the NASDAQ or the tech sector I decided to check out gold mining stocks, gold price and the Dollar index.
From looking at the price action among the precious metals sector and the dollar it looks and feels like these markets are very close to repeating what happened in the year 2000.
The chart below is a monthly chart looking all the way back to 1996. I have color coded areas of the chart that represent weak and strong times for the price of gold.
Gold Price
Key Points:
- The US Dollar is trading roughly at the same level and trending higher as it was in 2000.
- Rising dollar is neutral/negative on commodity prices and resource stocks like gold miners.
- Gold price struggled as the dollar rose in value.
- Gold stocks fell sharply during the last year of their bear market.
- Gold stocks bottomed before physical gold by several months
Concluding Thoughts on Dollar, Miners & Gold Price:
In short, I feel most of the downside damage has already been done to the price of gold. Gold stocks on the other hand could still get roughed up for a few more months before finding a bottom.
Money is likely to continue rolling into the dollar as a safe haven and this will keep gold and silver prices relatively flat. But once the dollar starts to show signs of increased volatility (top) similar to 2000 – 2001 money will find its way into other currencies and precious metals as the new trade and safe haven.
Get My Trades In Real-Time: www.TheGoldAndOilGuy.com
Chris Vermeulen

The size and existence of the modern state is limited only by the ability to borrow money; an ability dependent on the continuing value of fiat paper money. That limit has now been reached. Greece is not just a country that overindulged on the bankers’ poisoned candy of cheap credit. Greece is the canary in the coal mine of the modern state.
When gold was removed from the international monetary system in 1971, US interest rates were 6%. By 1980, however, US rates rapidly rose to 21.5% in order to contain virulent inflationary forces unleashed when ties between paper money and gold were cut. The separation of gold and money was unprecedented. So, too, would be the consequences.
CROSSING THE RUBICON: FALLING INTEREST RATES, THE DESTRUCTION OF CAPITAL AND THE END OF FIAT PAPER MONEY
US interest rates have now fallen for 35 years. In the short term, falling interest rates are viewed as positive, growth is encouraged and investors leverage ever-cheaper credit to reap ever-larger rewards in ever-expanding markets.
In the long term, however, continually falling interest rates are a sign that something is fundamentally amiss; that the requisite balance between credit and debt necessary for self-sustaining growth is missing. Continually falling interest rates—like continually falling blood pressure—indicates the presence of a pathological monetary state that is ultimately fatal.
In his article, Euthanasia of the Pension Funds, (Part 1) Professor Antal E Fekete pointed out the dangers of continually falling interest rates:
…a falling interest-rate structure has a deleterious effect on accumulated capital. Capital is destroyed across the board simultaneously and stealthily. By the time the damage is discovered, it is too late to do anything about it and firms go bankrupt in droves. The falling trend of interest rates is the unrecognized cause of the depression that is presently devastating the world economy.
…The last vestiges of the gold standard were unilaterally discarded by the government of the United States in 1971. This event was coincident with the onset of the greatest gyration in the rate of interest on a world-wide scale. In a decade interest rates shot up to two-digit figures in the high teens. Then a slow decline started in the 1980’s pushing interest rates relentlessly towards zero. The first move (rising interest rates) was accompanied with a great surge of inflation, wiping out a large part of the value of pension rights. The second move (falling interest rates), which is still continuing, has brought deflation. It has not yet fully manifested its corrosive on the pension funds as yet. Even so, the forces that drive the rate of interest to zero are squarely responsible for the erosion or destruction of all capital…
CONTINUALLY FALLING RATES AND EXCESSIVE MONETARY GROWTH
Below, I combined a chart of falling interest rates (greshams-law.com) with a chart of the US money supply (St. Louis Fed), further evidence of the destruction of capital.

Because of the continuing increase in the money supply, the dollars of today are worth less than yesterday’s and those of tomorrow will be worth less than today’s. We are now, all of us, running faster and faster at unsustainable levels on a treadmill towards inevitable disaster.
pg. 64, Time of the Vulture: How to Survive the Crisis and Prosper in the Process, 3rded. (2012), Darryl Robert Schoon
THE TIME OF THE VULTURE
When the Roman empire collapsed, even slaves feared what would happen next. It is no different today.
In the 1st edition of my book, Time of the Vulture: How to Survive the Crisis and Prosper in the Process (2007), I predicted a financial crisis even more devastating than the Great Depression was about to happen.
Today’s devastation will be even greater, because paper money is no longer backed by gold. The coming deflationary depression will involve not just the collapse of capital markets but, in addition, a cataclysmic currency crisis caused by the global destabilization of money.
When stocks lose their value
That’s a terrible thing
When homes lose their value
That’s a terrible thing
But when money loses its value
That’s the most terrible thing of all
Time of the Vulture (1st ed. 2007)
When I published Time of the Vulture, Fed interest rates were 5 ¼ %. When the financial crisis began in 2008, the Fed slashed rates to almost zero, 0.0-0.25%, to provide markets with excessive levels of liquidity to offset the sudden and severe drop in global aggregate demand.
Today, 90% of industrialized economies now have interest rates near zero or below zero.

In addition to near zero interest rates, central banks created excessive amounts of money by issuing trillions of dollars of bonds, e.g. QE1, QE2, QE3, QE4, etc. pushing unprecedented amounts of newly created money into global markets to contain the growing deflationary threat; and, while it failed to contain deflation, the excessive liquidity is now circulating in markets with no place to go, akin to moribund monetary edema.

In capitalism’s end game, capital instead of circulating in the economy accumulates in financial markets. Bubbles are the result, not economic expansion; and, as aggregate demand fatally slows, so, too, does the velocity of money.
 http://chartramblings.blogspot.com/2014_04_01_archive.html
Capitalism, like a bicycle, doesn’t do well at slow speeds
In the 1930s, when global demand collapsed, countries fought for shares of a shrinking market by levying tariffs on imported goods. The US Smoot-Hawley Tariff imposed surcharges on over 20,000 imported goods to record levels. Enacted to protect domestic markets from foreign imports, the net effect, however, was to accelerate the collapse of international trade.
 http://www.theautomaticearth.com/2010/07/the-rise-and-fall-of-trade/
As in 1929, international trade fell in 2009; but, this time, countries moved to protect markets not with tariffs but by debasing their currencies with excessive money printing, making their exports cheaper in foreign markets.

Debasing currencies to obtain a trade advantage, however, is akin to the Chinese proverb, Drinking poison to quench thirst, 飲鴆止渴. While the advantages are temporary, the consequences are not.
In November 2012, I wrote:
There are only two possibilities left in the bankers’ end game. Either deflation’s growing momentum will pull today’s faltering economies into the ever-growing maw of a deflationary collapse or the continued printing of money to stave off such a collapse will end with the complete debasement of paper currencies in a hyperinflationary blowoff.
Schoon, The Tipping Point (2012)
Today’s excessive money printing—whether to gain a trade advantage or to prevent a deflationary collapse—will end in the cataclysmic collapse of today’s fiat currencies and the consequent disarray of global markets and sovereign states.
GOLD BULLION – A LIFE INSURANCE POLICY ON FIAT PAPER MONEY
When paper money dies, the payout will be spectacular
GOLD IS VOLATILE WHEN CONDITIONS ARE VOLATILE
GOLD IS STABLE WHEN CONDITIONS ARE STABLE
That’s it, plain and simple. The more chaotic the monetary conditions, the more chaotic the price of gold. Gold is a barometer of economic uncertainty. In times when inflation threatens, gold moves up and down. In times when deflation threatens, gold moves up and down. When both inflation and deflation threaten, gold moves rapidly up and down.
Pg. 127, Time of the Vulture, 3rd. ed. 2012, Schoon
After 2001, gold moved upwards, from $250 to $1900 in 2011. Since 2011, gold has retraced 42 % of those gains. This had a negative effect on many gold investors. Indeed, that was the purpose of the bankers’ war on gold after 1971.
For those who understand the tremendous financial and geopolitical forces that today are vying not so much for supremacy as they were previously, but for survival; gold remains as it always has been—a store of value in times of monetary chaos and economic distress.
In March 2007, I predicted that an economic crisis would happen. It did. That crisis has yet to run its course to make way for the better world to come. In my Dollars & Sense youtube video, Darryl’s New Prediction, see https://youtu.be/qZJCTCO36DM. I make another forecast.
These are interesting times. Get used to it.
Buy gold, buy silver, have faith.
Darryl Robert Schoon
 With gold, silver and crude oil on the move, today King World News wanted to take a step back and look at 7 of the most jaw-dropping charts of 2015.
The following charts are from the Wall Street Journal. The first chart below from WSJ shows that Chinese industrial output is at its lowest since the end of 2008.

….view all 7 HERE


-
I know Mike is a very solid investor and respect his opinions very much. So if he says pay attention to this or that - I will.
~ Dale G.
-
I've started managing my own investments so view Michael's site as a one-stop shop from which to get information and perspectives.
~ Dave E.
-
Michael offers easy reading, honest, common sense information that anyone can use in a practical manner.
~ der_al.
-
A sane voice in a scrambled investment world.
~ Ed R.
Inside Edge Pro Contributors

Greg Weldon

Josef Schachter

Tyler Bollhorn

Ryan Irvine

Paul Beattie

Martin Straith

Patrick Ceresna

Mark Leibovit

James Thorne

Victor Adair