
Stocks & Equities
STRATEGY OF THE WEEK
The Abnormal Action Market Scan strategy looks for stocks making abnormal price jumps on the daily chart. Where these jumps come from after predictive chat patterns, there is a signal to take a position trade. I ran this scan on Monday morning and found a few that look pretty good:
STOCKS THAT MEET THAT STRATEGY
1. ANTH
ANTH is breaking to the upside after bouncing off of its upward trend line. It is breaking the shorter term downward trend line, indicating the market is back to being Bullish on the stock

2. VIMC
I featured VIMC to my daily newsletter subscribers (www.tradescores.com) on Friday after it made a break from a good pattern. It is up another 13% today and still has that good pattern break which should lead it in to a long term upward trend. Support at $8.85.

3. RDN
RDN is a stock that I featured a few months ago at $16.38, it is making a good long term breakout today and looks like a good position trade candidate. Support now at $17.

Continue reading Tylers Full Perspectives Newsletter HERE

With Friday’s weakness, a down-trending consolidation is in place. The consolidation makes it difficult to leverage at trade in the rapid 1-2 day short term moves, but at some point, the market will break in one direction or the other out of the consolidation. So we have to be prepared to act on that break.
That being said, let’s take a seasonal look at our key vehicles:

While I pointed the arrow lower in the chart above, there’s a high likelihood of a continuation of the advance . There hasn’t been more than one day of follow through on these large one day down moves in some time.

Bonds are the key, but they’d have to move back and retest highs if the stock market is going to remain weak.

I’m still leaning towards the dollar consolidating the very large recent move higher. That will help other assets.

But gold is done – the move should continue lower for a long time…

Oil on the other hand, has significant potential. It’s not always driven by production and storage levels.

Nat Gas is relatively new for us, so we’re still looking at underlying trading patterns in the derivatives to draw more conclusive trading. We look at about 10 variables of trading these commodities for correlative approaches to trading. We’re not rushing it. But we’ll periodically test our findings with trades when the opportunities arise.
Putting it all together, the stock market could break here, but the consolidation that started with the 3/2 peak is continuing and behaves pretty normal. I’d expect a day of weakness and a pause then another push higher to bring this 5 year rally to a more significant end…
Regards,

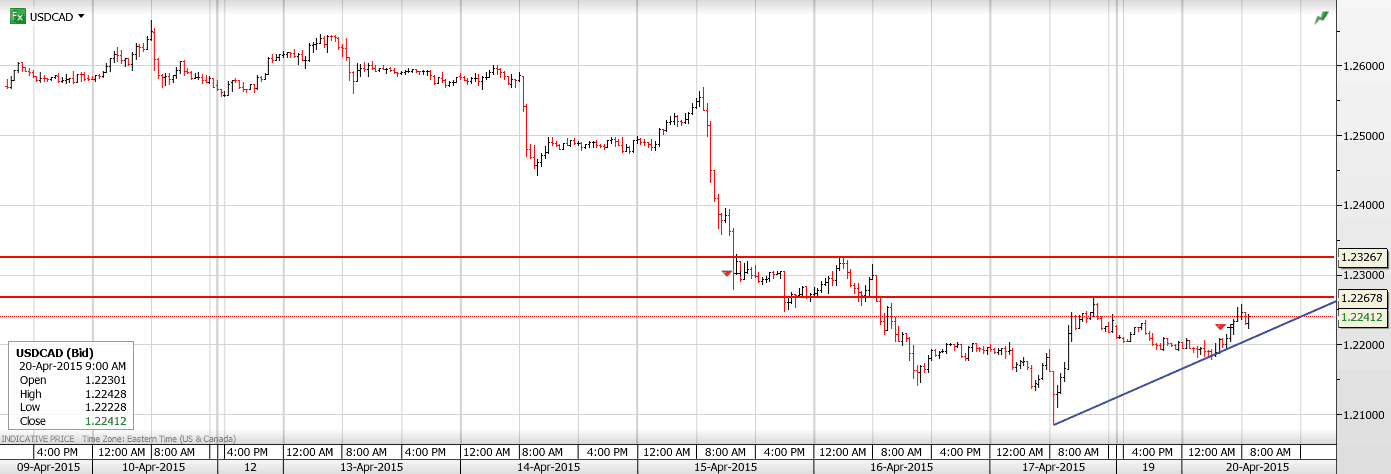
USDCAD Overnight Range 1.2183-1.2255
USDCAD was largely sidelined overnight and remains well off of Friday’s lows as it currently probes resistance in the 1.2250 area. The fundamental outlook for the Loonie has taken a turn for the good on the back of a rosier economic outlook by the Bank of Canada and better than expected economic data last Friday. Higher oil prices are also supporting the Canadian dollar.
China kicked off the FX week when the PBoC announced a 100 point cut in the Reserve Requirement Ration (RRR), hoping to boost bank lending. The news lifted AUD and NZD but that only lasted a short while and both currencies quickly returned to Friday’s lows during the European session. EURUSD trading will be governed by Greece news while the pound will be pounded by UK election headlines.
The BoC governor, Stephen Poloz, will be speaking in New York this morning and traders will be looking for additional bullish CAD remarks. Tomorrow’s Federal budget should be a non-event although forecasts for balanced budgets may help the currency.
USDCAD technical outlook
The intraday USDCAD technicals are modestly bullish while trading above 1.2210 looking for a break of resistance at 1.2260 to extend gains to 1.2320. A move below 1.2210 argues for a retest of the Friday low of 1.2089. For today, USDCAD support is at 1.2210 and 1.2160. Resistance is at 1.2250-60, 1.2290 and 1.2320
Today’s Range 1.2180-1.2260

 Martin here with an update on global markets. So far this year, while U.S. stocks have flat-lined …
Mumbai has surged …
Hong Kong and Shanghai have gone through the roof, and …
Despite all its troubles, Moscow has rocketed like a Topol-M intercontinental ballistic missile.
They’re what I call “blast-off markets.” And they’re proving how quickly things can change.
Late last year, for example, if some analyst told you to buy China or India, you’d say he’s nuts.
And if someone tried to pitch Russia, you’d throw him out on his rear end.
The overseas news was so outrageously shocking, it would have felt like volunteering for duty in Dante’s inferno.
But now, suddenly, the small handful of investors who risked those hellish fires are making money hand over fist.
Or look back a half century, and you’ll see an even more radical kind of change.
I know. Because I was there. In 1958, my father’s office was on Broad Street, next door to the New York Stock Exchange. That’s where I used to spend my days off from school, helping him dig through company reports or plot his stock charts.
And even before I was born, emerging markets were his favorite place to explore — for both lifestyle and investments.
But if you think investing in emerging markets is risky now, imagine back then! It wasn’t just risky. It was virtually impossible — even for sophisticated investors.
Yet, strange as it may seem to most people today, that’s precisely what my family did — starting in pre-Castro Cuba, Costa Rica and Brazil.
We were virtually the only ones — and the reason was obvious.
 To properly invest in those countries, we had to travel there in person, exchange our dollars into local currency, set down roots, open up local accounts, and only then start thinking about buying something.
Agricultural land and enterprises were at the top of my parents’ list.
If that meant my mother had to get her feet muddy and try plowing the soil with a couple of oxen, that was all part of the due diligence.
Today, you don’t have to leave your home. You don’t need a phone or even a computer. All you have to do is whip out your iPad, open your online brokerage app, press a couple of buttons, and …
Presto! You can instantly own the most widely traded, highest quality companies in the biggest blast-off markets of the world.
Don’t get me wrong. I’m not telling you to do that today. Rather, my task today is strictly to provide some facts, disclose the risks, and give us — both you and me — some more time to think about it.
The Facts
From the beginning of the year through the closing prices this past Friday, the ETF that tracks the S&P 500 (SPY) is up 2.4%. Not much.
Meanwhile, though …
INDY, the main India ETF, is up 8.4% — over three times more …
FXI, the big-cap China ETF, is up 23.4% — nearly ten times more, and …
RSX, the primary Russia ETF is up 40% — a shocking 17 times more!
The Risks
Many investors won’t touch these markets with a ten-foot-pole, essentially for two reasons.
The first reason is risk and angst.
 China, they say, is slowing down and vulnerable to a housing bust. I’ve been all over China. So I know what they’re talking about.
But I’ve also seen a side of China, especially in the dynamics of its population, that tell a very different story.
 Brazil, they point out, is mired in a massive corruption scandal that has practically sunk its biggest oil conglomerate and gutted its political leadership. And they’re not wrong about that either. I first went to Brazil when I was six and was also there last month. I’ve seen the mess the country is in, first hand. But I’ve also seen the amazing potential that Brazil still has.
 Russia, as everyone knows, is wallowing in the cesspool of a broken currency, a broken economy and more widespread corruption than Brazil or China combined. I mostly agree. I’ve traveled to Russia’s biggest cities and its smallest villages.
But I’ve also seen another side of Russia, which I’ll tell you more about another day.
The $64,000 question: Is all the bad news mostly old news that’s already reflected in their stock values, already battered severely last year? Or are there entirely new, hidden dangers still to be revealed?
The second reason investors shy away is resentment and anger.
China, they argue, is attacking us in cyber space and conquering disputed areas in the South China Sea.
Russia is effectively waging war against the West — with support for rebels in Ukraine, with embargos, and with the harshest anti-American rhetoric since the Cold War.
How can we turn a blind eye and effectively reward them for their bad behavior?
Good question. Suffice it to say that you have two choices:
You can base your investment decisions mostly on philosophy and politics. Or …
Either path can be justified. Both have risks. But I feel you do have to make a choice. You can’t invest for profits one day and for ethics the next day. You can’t combine these two fundamentally different approaches in one magical brew.
My recommendation: Follow the path that’s the most likely to succeed. Use the strategy that can do the best job of building your retirement nest egg with safety. And then, if you have some money left over, you will always have the freedom to support the cause that can make a difference.
That’s what I’m doing. And in the weeks ahead, I’ll give you more details about precisely where and how.
Good luck and God bless!
Martin

When it comes to investing in gold, for the most part, the U.S. Gold Market is completely insane. I am not blaming Americans, as they have been totally brainwashed by the U.S. Treasury and Federal Reserve into believing that gold is something you wear, not invest in.
This is certainly proven by the data shown in the chart below. These figures come from the World Gold Council Full Year Demand Trends Reports, and while it may be true that the data is manipulated or incomplete, it’s the best we can go by. And I believe it gives us a pretty good idea of the insanity taking place in the good ole US of A.
From 1999 to 2007, Americans purchased a staggering 3,196 metric tons (mt) of gold jewelry for adornment purposes. That translates to an amazing 103 million ounces(Moz). The reason Americans purchased so much gold jewelry during this nine-year period was due to the low price of gold (especially 1999-2005):

During this same time period, Americans purchased 231 mt of gold for investment. This turns out to be a
whopping 7.4 Moz. As the chart above shows, gold investment was a lousy 7% of the pie, whereas gold jewelry stole the show by consuming 93% of these two markets.
If we look at the next bar in the middle of the chart (2008-2014), we can see a distinct change in American gold buying habits. First, as the price of gold skyrocketed, less Americans could afford to purchase gold jewelry for adornment bragging rights. Secondly, more Americans were starting to buy gold as an investment due to the near collapse of the U.S. financial system in 2008.
From 2008 to 2014, gold jewelry demand fell considerably to 992 mt, while gold investment more than doubled to 545 mt. Thus, retail gold investment over this eight-year time period was 35% of these two markets, while jewelry declined to 65%. In 2010, retail gold investment peaked at 45% of the total as jewelry fell to 55%.
Even though retail gold investment picked up in the United States after 2007, the total since 1999 was 776 mt compared to 4,188 mt of gold jewelry purchases. Again, this translates to 25 Moz of retail gold investment versus 135 Moz of gold jewelry for adornment purposes.
Now, I say adornment because as the financial situation became rough for Americans after 2007, the market experienced a huge increase in the”Scrap Gold for Money” market. Americans no longer enjoyed the bragging rights to wear gold, instead they pawned Billions of Dollars worth of scrap gold over the next several years. Do you think the folks in India pawned off their gold jewelry when prices declined… LOL.
Before I end this short article with the last TIDBIT that really proves the point that the U.S. Gold Market is completely insane… I want to explain why I have cut back on publishing articles on the site recently.
I am working on my actual first soon to be published PAID REPORT on the Silver Market. I mentioned before that I had planned to publish a U.S. GOLD MARKET REPORT, which the chart in this article was a part of, but did not do so because the information I received from the USGS on NY Fed gold withdrawals was incorrect. I am not going to get into the details, but just to say the main assumption of the report was no longer valid. I had planned to rewrite the report because there is a lot of valuable and interesting information, but I decided to start working on some PAID SILVER REPORTS instead.
I plan on publishing three paid reports on the Silver Industry and Market. This is where a great deal of my time is being sucked into. However, I believe my followers, readers and new guests to the site will find the data and information in these reports well worth the money and time to read.
I plan on publishing the first report next month as the report is currently two-thirds written. I will update the status of the publication date as I complete the report.
Okay…let’s get back to the lunacy of the U.S. Gold Market. As I mentioned, Americans were buying more gold as an investment after the collapse of the U.S. Investment Banking Market in 2008 and less gold jewelry as the price skyrocketed. However, something changed in 2014.
As the rest of the world (mainly China, Asia & India) took advantage of bottom basement gold prices in 2014 by adding gold to their investment stash, what did Americans do? LOL…. you got it. Americans increased their gold jewelry buying once again, to a hefty 179 mt. The last year Americans purchased more was in 2008 at 188 mt.
And of course, if Americans are going to take advantage of low gold prices to purchase more gold jewelry, why then it makes perfect sense for U.S. citizens to also cut back on investing in that yellow barbarous relic. Which they did. In 2014, Americans bought a pathetic 47 mt of retail gold investment, down from 67 mt in 2013.
Finally, the United States is heading for serious trouble. Because we have the world’s best printing press, we have been able to postpone the inevitable for a while. Unfortunately, there is way too much INSANITY taking place in every aspect of our society, economy and financial system that the TRUTH will not set us FREE, but rather cause the greatest collapse the world has ever seen.
I really don’t know how events are going to unfold when we finally HEAD OVER THE CLIFF, but I know enough to purchase gold as an investment rather than highly marked-up gold jewelry so I look better buying that $5 cup of coffee at Starbucks.
Please check back for new articles and updates at the SRSrocco Report. You can also follow us at Twitter:

-
I know Mike is a very solid investor and respect his opinions very much. So if he says pay attention to this or that - I will.
~ Dale G.
-
I've started managing my own investments so view Michael's site as a one-stop shop from which to get information and perspectives.
~ Dave E.
-
Michael offers easy reading, honest, common sense information that anyone can use in a practical manner.
~ der_al.
-
A sane voice in a scrambled investment world.
~ Ed R.
Inside Edge Pro Contributors

Greg Weldon

Josef Schachter

Tyler Bollhorn

Ryan Irvine

Paul Beattie

Martin Straith

Patrick Ceresna

Mark Leibovit

James Thorne

Victor Adair