
Timing & trends
Most Read this week:
1. Forget the politics – LOVE the new TFSA policy by Craig Burrows
2. Important Q&A With Larry Edelson
 Rumors abound that the Chinese yuan will soon be given reserve status by the World Bank or IMF. That might occur as early as October. It is also said that the U.S. dollar will crash as a result.
Why are you so bullish on Asia, China, while so many analysts are bearish?
Is gold still on track for lower lows? Silver?
Larry’s latest on the U.S stock markets
3. Are Gold Stocks the Cheapest Ever?

As we penn this article Gold is trading below $1180/oz and set to close at its lowest level in six weeks. Gold is less than 2% from its weekly low of $1158. It is fairly close to another technical breakdown. However, the gold mining stocks appear to be bucking the trend and showing increasing relative strength. It appears likely that the stocks have bottomed relative to the metal and maybe so in nominal terms.
Below we plot various gold miner indices against Gold. We essentially plot the juniors and large caps from both the US and Canada against GLD. Not only have these ratios increased in recent months but they have increased in the past few weeks as Gold has declined from $1220 down below $1180. That is a very important signal of relative strength.
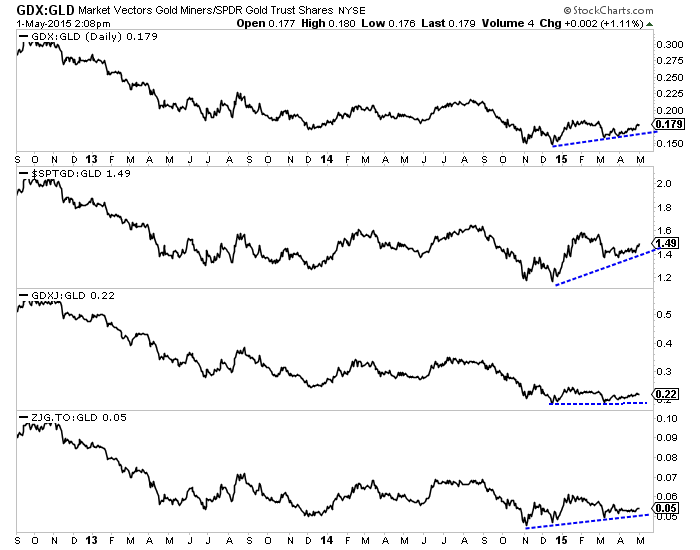
Miners vs. Gold
The price action in nominal terms would have been far more encouraging if the miners had closed near their weekly highs. The weekly candle charts for GDX and GDXJ are below. The miners are up for the week but failed to hold the majority of the gains. GDX touched $20.90, which is 7% from its 80-week moving average. If it could reach that resistance it would mark the third test in the past ten months (after previously no tests in two years). That would be a strong signal of a transition from a bear market to a bull market.
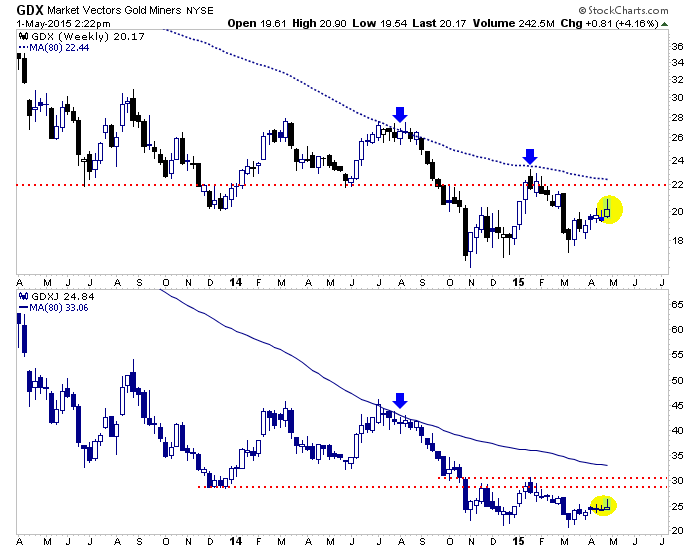
Weekly GDX & GDXJ
The reasons for the gold miners’ relative strength are unlikely to be temporary. Sure Oil has rebounded but its price remains well below the $100/barrel it averaged throughout 2011 to 2014. That is helping miners. In addition, local currency weakness has been a boon. Even though the US$ index has stalled out, the Gold price against foreign currencies is 20% above its December 2013 low. That helps miners operating outside of the US with some costs denominated in local currencies. Other factors to consider include the strength in the two largest gold miners Newmont and Barrick and the fact that gold stocks recently were potentially the cheapest in history.
The gold miners can continue to show relative strength but they may not rip to the upside until Gold cooperates. A weekly close below $1150/oz could accelerate Gold’s final breakdown. On the other hand, a weekly close above $1220 would be bullish. I would actually prefer the former as it would give us real clarity to the end of the bear market and it would give us a final chance to buy miners before they explode to the upside.
Jordan Roy-Byrne, CMT

 If U.S. economic growth falls any lower, we are officially going to be in recession territory. On Wednesday, we learned that U.S. GDP grew at a 0.2 percent annual rate in the first quarter of 2015. That was much lower than all of the “experts” were projecting. And of course there are all sorts of questions whether the GDP numbers the government feeds us are legitimate anyway. According to John Williams of shadowstats.com, if honest numbers were used they would show that U.S. GDP growth has been continuously negative since 2005. But even if we consider the number that the government has given us to be the “real” number, it still shows that the U.S. economy has stalled out. It is almost as if we have hit a “turning point”, and there are many out there (including myself) that believe that the next major economic downturn is dead ahead. As you will see in this article, a whole bunch of things are happening right now that we would expect to see if a recession was beginning. The following are 16 signs that the economy has stalled out and the next economic downturn is here…
#1 We just learned that U.S. GDP grew at an anemic 0.2 percent annual rateduring the first quarter of 2015…
The gross domestic product grew between January and March at an annualized rate of 0.2 percent, the U.S. Commerce Department said, adding to the picture of an economy braking sharply after accelerating for much of last year. The pace fell well shy of the 1 percent mark anticipated by analysts and marked the weakest quarter in a year.
….#2 – 16 HERE

 With the S&P 500 index hovering less than 2 percent below its record high, many market participants are calling for a correction of about 10 percent. Marc Faber, editor of The Gloom, Boom & Doom Report, is calling for a little more than that.
“For the last two years, I’ve been thinking that U.S. stocks are due for a correction,” he told CNBC. “But I always say a bubble is a bubble, and if there’s no correction, the market will go up. And one day it will go down, big-time.”
….read more HERE
Also from Marc:
Chinese Markets an Accident waiting to happen

The US Treasury market topped with our upside Exhaustion Alerts in January and then found initial support around the weekly moving averages (30-week average on the long bond and 40- week on the TLT). The bounce was anticipated to provide a selling opportunity in the TLT in the range of 133 to 135. The rally petered out at 132.64 and is now breaking down. The major support will now be at the 100-month moving average around 108 on the TLT. This equates to a 2.7% yield on the 10’s and 3.6% on the 30s.

The opinions in this report are solely those of the author. The information herein was obtained from various sources;
however we do not guarantee its accuracy or completeness. This research report is prepared for general circulation and is circulated for general information only. It does not have regard to the specific investment objectives, financial situation and the particular needs regarding the appropriateness of investing in any securities or investment strategies discussed or recommended in this report and should understand that statements regarding future prospects may not be realized.
Investors should note that income from such securities, if any, may fluctuate and that each security’s price or value may rise or fall. Accordingly, investors may receive back less than originally invested. Past performance is not necessarily a guide to future performance. Neither the information nor any opinion expressed constitutes an offer to buy or sell any securities or futures contracts. Foreign currency rates of exchange may adversely affect the value, price or income of any security or related investment mentioned in this report. In addition, investors in securities such as ADRs, whose values are influenced by the currency of the underlying security, effectively assume currency risk. Moreover, from time to time, members of the Institutional Advisors team may be long or short positions discussed in our publications.
April 22, 2015 Technical observations of Ross Clark

-
I know Mike is a very solid investor and respect his opinions very much. So if he says pay attention to this or that - I will.
~ Dale G.
-
I've started managing my own investments so view Michael's site as a one-stop shop from which to get information and perspectives.
~ Dave E.
-
Michael offers easy reading, honest, common sense information that anyone can use in a practical manner.
~ der_al.
-
A sane voice in a scrambled investment world.
~ Ed R.
Inside Edge Pro Contributors

Greg Weldon

Josef Schachter

Tyler Bollhorn

Ryan Irvine

Paul Beattie

Martin Straith

Patrick Ceresna

Mark Leibovit

James Thorne

Victor Adair