
Asset protection
 Staggering U.S. Debt Worrying The Fed And Hurting U.S. Economy
I think the US is trying to pull itself up by its bootstraps. The problem is the massive US debt of over $17 trillion. I think the Fed’s idea is to get the economy growing again, start paying off the debt, and all will be well. The key to the strategy is whether the Fed can get the US economy growing again. On this basis, I’ll be watching the stock market for the answer to whether the US economy can be revived.
….read more HERE

 We Can’t Rein In the Banks If We Can’t Pull Our Money Out of Them
One of Wall Street’s best known adages is the old “sell in May and go away” seasonal trick. The idea is that the six months starting in May — including the normally listless summer months — are among stocks’ poorest performers of the year.
It helps that it kind of rhymes. Just try to say, “Sell in April and … um … ” You see, nothing rhymes with April except maybe fatal and evil, so it would never make the cut for a cutesy adage. Same with February.
The folks over at the Stock Trader’s Almanac popularized the May-away strategy in 1986 and put hard numbers behind the old Street folklore: A $10,000 investment in the Dow Jones Industrials compounded to $816,984 for November through April in 64 years vs. a $221 loss over the same period for May through October. Since 1997, the Dow has climbed higher in May only seven times in the past 17 years, including 2013 and 2014.
What should investors expect in 2015?
The market has stalled over the last few months on Fed rate hike fears — fears that have diminished somewhat as the economic data has cooled. The Atlanta Fed’s GDPNow estimate for second-quarter growth is tracking at just 0.9 percent, suggesting the first-quarter weakness wasn’t just weather related. Corporate earnings have turned into a drag as well with big, high-profile misses by one-time social media up-and-comers Twitter (TWTR) and LinkedIn (LNKD) last week.
And investor sentiment is extended. According to calculations by Ed Yardeni of Yardeni Research, the Investor Intelligence Bull-to-Bear Ratio’s 52-week moving average has reached its highest level ever since the data series started in 1987.

But the two big dynamics that have driven stocks higher this cycle — an accommodative Fed and the flow of capital back to investors via share buybacks and dividends — look set to continue.
The Financial Times highlighted a few weeks ago that shareholders of the largest U.S. companies are set to receive a record $1 trillion in cash this year through dividends and buybacks. Last year, the total was $904 billion. And in the weeks to come, unless the macro data makes a massive turn to the upside, the Fed will be forced to acknowledge the economy just isn’t yet ready for higher rates — moving their expectations into alignment with where the futures market already is and unleashing a summertime rally of the type seen last year.
Partly fueling the rally will be the realization that most investors had 2015 completely upside down when looking ahead in late 2014. Remember how everyone thought the U.S. was the one strong economy in a world of weak growth elsewhere? It’s turned out that China GDP is running at around 5 percent, the euro zone is perking up finally with an infusion of QE and could see 2 percent growth, and Japan is even awakening in synch with a massive QE program.
Wouldn’t it be ironic if by midyear the consensus comes to believe the United States is the global goat rather than the lion? If the consensus then figures rate hikes will be pushed off to mid-2016, perhaps then U.S. stocks would join their counterparts overseas in finally kicking higher. Just a thought to put in your back pocket.
Best wishes,
Jon Markman

Stocks in long term upward trends often make pullbacks as short term minded investors take profits. There is an opportunity to buy these stocks when they break their pull backs. This week, I ran the Pull Back Play Canada market scan and found a couple of strong stocks that look like they may continue their long term upward trends.
STOCKS THAT MEET THE FEATURED STRATEGY
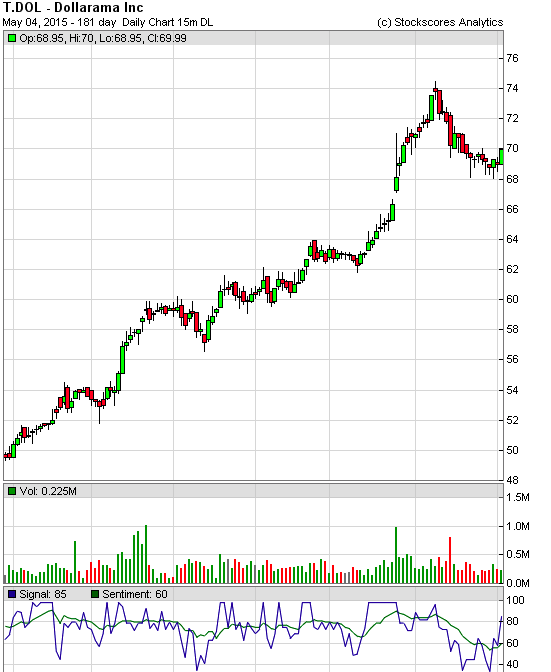
1. T.DOL
T.DOL has been falling for the last three weeks and that has taken the stock back to the long term upward trend line. Today, the stock broke the pullback, setting it up for a swing trade on a resumption of the trend. Support at $68
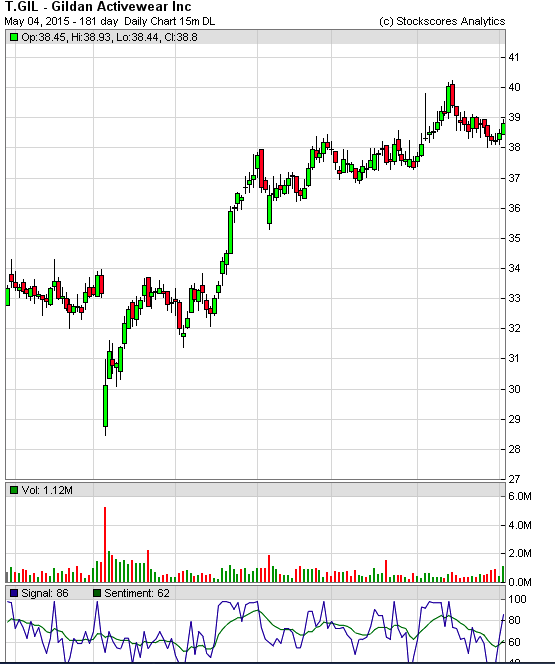
2. T.GIL
T.GIL has been a leader in the Canadian market for three years and looks like it may continue the long termupward trend soon. Breaking today from a two week pullback, should move higher in the weeks ahead. Support at $38.
WEEKLY COMMENTARY
Avoid the Negatives
As investors, our natural inclination is to seek out stocks that have good qualities. We look for reasons to buy the stocks we are considering and often forget to look for the negatives. Since there are thousands of stocks to consider and almost all of them can have some reason for buying them, it may be better to reverse how we approach the analysis of stocks. Looking for reasons not to buy a stock will emphasize a higher standard for the stocks you do buy and will help to improve your overall market performance.
Here is a list of common reasons I use to throw a stock out of consideration:
Too Much Volatility
Volatility is uncertainty. Virtually every good chart pattern that I use to find winners demonstrates a break out from low volatility. The narrower the range before the breakout, the more important the breakout becomes. If the stock’s price is moving all over the place before it makes a break through resistance then there is a much greater chance that the breakout is false and will likely fall back. Ignore stocks that have a lot of price volatility before the break out.
Not Enough Reward for the Risk
A stock can go two ways, up or down, after you buy it. If the upside potential is not enough to justify the downside risk, then you should ignore the opportunity. I like stocks to have at least double the upside potential for the downside risk. That way, you don’t have to be right even half of the time to make money, provided you are disciplined of course.
Lack of Optimism
Fundamentals do not matter. It is the perception of Fundamentals that matter. If investors are not showing some optimism about a company’s prospects then it is likely that they are not paying any attention to the company’s fundamentals. Look for rising bottoms on the chart as an indication that investors are optimistic, if there aren’t any, leave the stock alone.
No Abnormal Behavior
The stock market is efficient most of the time. That means that you can not expect to consistently beat the stock market because all available information is priced in to the stock and your success at predicting new information can only be random. To beat the market, we have to look for break downs in market efficiency. I find that the best way to do this is look for abnormal behavior in the trading of a stock because it implies that there is significant new information playing a role in the stock’s performance. I don’t consider any stock that lacks abnormal behavior in its recent trading.
Too Far Up
The higher a stock goes, the riskier it becomes. I don’t like to chase stocks higher. If I look at a 6 month chart of a stock and it has made more than two steps up, I don’t consider it. A one day run of substantial gains is not a concern; I want to ignore stocks that have been in upward trends for some time. Look for stocks that are breaking from periods of sideways trading, not up trends.
Lack of Liquidity
The more often a stock trades, the easier it is to get in and out of it. Stocks that are not actively traded tend to have wider spreads between their bids and asks and it can be difficult to move in and out of the stock. Don’t consider stocks that don’t trade every day and they should trade at least 50 times a day but more is better.
Mixed Messages
I always try to look at a stock’s chart on more than one time frame. If the message is not the same on both charts, I leave them alone. When day trading, look at the daily and intraday charts. When position trading, look at the daily and weekly charts.
Any time you think a stock has great potential, give this list a look and see if any of these factors show up. If so, it may be a good idea to move on and look for something else.
Stockscores Free Webinar – How I Day and Swing Trade the Market
Wednesday May 6 – 11:00 am PT, 2:00 pm ET
Stockscores founder Tyler Bollhorn will demonstrate his processes and tools for identifying day and swing trades live during the trading day. See some of the trades that fit his requirements before the market close.
Stockscores Free Webinar – The Secret to Finding Hot Stocks
Saturday May 9 – 11:00am PT, 2:00 pm ET
For over 25 years, Stockscores founder Tyler Bollhorn has been picking winning stocks using one simple concept. During this webinar, you will learn his secret for finding the hot stocks of the future and get a demonstration of the tools he has built to find them.
For a complete list of upcoming webinars, go to www.stockscores.com/webinars
Stockscores Market Minutes Video – When Good Stocks Go Bad
Some good looking stocks are capable of big gaps to the downside causing big losses for their owners. This week, I discuss why this happens and how to avoid it. Plus, my regular weekly market analysis.
References
- Get the Stockscore on any of over 20,000 North American stocks.
- Background on the theories used by Stockscores.
- Strategies that can help you find new opportunities.
- Scan the market using extensive filter criteria.
- Build a portfolio of stocks and view a slide show of their charts.
- See which sectors are leading the market, and their components.
Disclaimer
This is not an investment advisory, and should not be used to make investment decisions. Information in Stockscores Perspectives is often opinionated and should be considered for information purposes only. No stock exchange anywhere has approved or disapproved of the information contained herein. There is no express or implied solicitation to buy or sell securities. The writers and editors of Perspectives may have positions in the stocks discussed above and may trade in the stocks mentioned. Don’t consider buying or selling any stock without conducting your own due diligence.

Silver smashing against an extreme outer channel, looks like an mini head and shoulders, that will break higher rather than lower.
Previous post: This chart shows an extreme sell down, time to watch this security daily – Update
Option expiration week is over, extreme volatility of last week ends (we assume), now it is the time to see if metals will show signs of bullishness. Maybe forecasting a longer USD sideways move.
Latest chart.

Previous update chart
 Larger Image
NOTE: readtheticker.com does allow users to load objects and text on charts, however some annotations are by a free third party image tool named Paint.net
Investing Quote…
“Money is made in tape reading [chart reading] by anticipating what is coming — not by waiting till it happens and going with the crowd.” ~ Richard D Wyckoff
“The four most dangerous words in investing are ‘This time it’s different’.” ~ John Templeton


-
I know Mike is a very solid investor and respect his opinions very much. So if he says pay attention to this or that - I will.
~ Dale G.
-
I've started managing my own investments so view Michael's site as a one-stop shop from which to get information and perspectives.
~ Dave E.
-
Michael offers easy reading, honest, common sense information that anyone can use in a practical manner.
~ der_al.
-
A sane voice in a scrambled investment world.
~ Ed R.
Inside Edge Pro Contributors

Greg Weldon

Josef Schachter

Tyler Bollhorn

Ryan Irvine

Paul Beattie

Martin Straith

Patrick Ceresna

Mark Leibovit

James Thorne

Victor Adair