
Stocks & Equities
Stocks Continue Their Downtrend Following Worse-Than-Expected Economic Data Releases
Briefly: In our opinion, speculative short positions are favored (with stop-loss at 2,140, and profit target at 1,980, S&P 500 index)
Our intraday outlook is bearish, and our short-term outlook is bearish:
Intraday outlook (next 24 hours): bearish
Short-term outlook (next 1-2 weeks): bearish
Medium-term outlook (next 1-3 months): neutral
Long-term outlook (next year): bullish
The U.S. stock market indexes lost 0.5-0.7% on Wednesday, extending their short-term downtrend, as investors reacted to economic data releases. Our yesterday’s bearish intraday outlook has proved accurate. The S&P 500 index is close to support level of 2,070-2,080. On the other hand, level of resistance remains at around 2,100. There have been no confirmed negative signals so far, however, we still can see negative technical divergences:
 Larger Image
Expectations before the opening of today’s trading session are negative, with index futures currently down 0.7-0.8%. The main European stock market indexes have lost 1.5-2.1% so far. Investors will now wait for some economic data announcements: Challenger Job Cuts report at 7:30 a.m., Initial Claims at 8:30 a.m. The S&P 500 futures contract (CFD) is in an intraday downtrend, as it extends its short-term move down. The nearest important support level is at 2,030-2,050 and resistance level is at around 2,080, marked by recent local high, as we can see on the 15-minute chart:

The technology Nasdaq 100 futures contract (CFD) extends its short-term downtrend, trading below the level of 4,350. The nearest important level of resistance is at around 4,360-4,380, as the 15-minute chart shows:

Concluding, the S&P 500 index continued its short-term downtrend yesterday, as investors reacted to worse-than-expected economic data announcements, among others. We continue to maintain our speculative short position (2,098.27, S&P 500 index), as we expect a downward correction or an uptrend reversal. Stop-loss is at 2,140, and potential profit target is at 1,980. You can trade S&P 500 index using futures contracts (S&P 500 futures contract – SP, E-mini S&P 500 futures contract – ES) or an ETF like the SPDR S&P 500 ETF – SPY. It is always important to set some exit price level in case some events cause the price to move in the unlikely direction. Having safety measures in place helps limit potential losses while letting the gains grow.
Thank you.

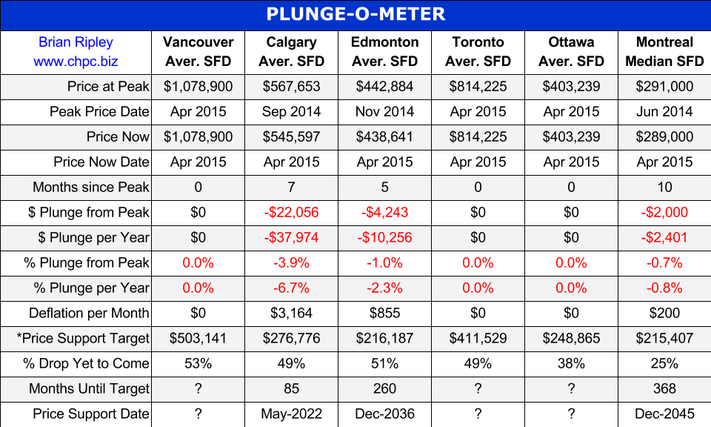

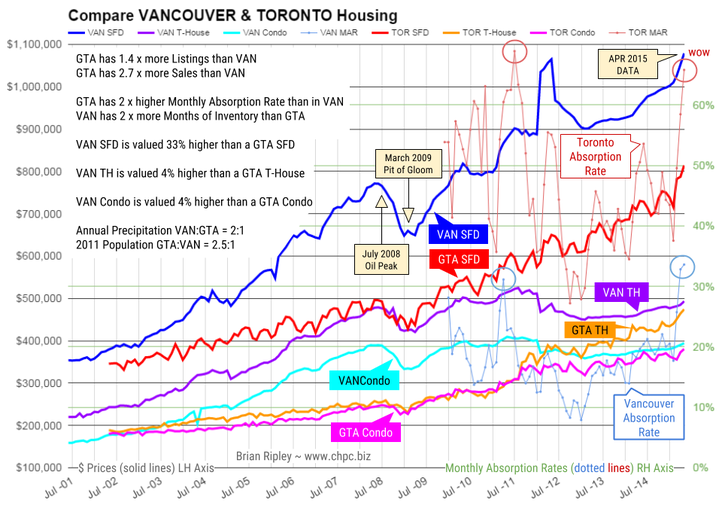
The chart above shows the average Single Family Dwelling, Townhouse and Condo prices (solid plot lines) of both Vancouver and Toronto as well as the Monthly Absorption Rate (MAR = Sales/Listings as dotted plot lines). At the Vancouver peak in April 2012, Vancouver metro SFDs were an astounding 64% (1.6 times) more expensive than GTA comparables. But Toronto has been on a tear out of the March 2009 Pit of Gloom and the SFD price differential has shrunk to 33% (1.3x) even with the current (April 2015) peak average SFD price in Vancouver.
…..for larger chart & to read more go HERE
First, this flash update. The Dow lost 142 points yesterday, which, in today’s volatile market, is no big deal.
Nevertheless, our proprietary short-term stock market indicator has turned starkly negative, as shown below:

Yes, the near-term outlook is darkening. Our model suggests a MINUS 6.4% return from the stock market over the next 94 days. Take warning.
As to the long-term outlook…
The Longest, Deepest Depression in US History
Yesterday’s good news was that there will be no 25-year recession. “We should be so lucky,” is the way a New Yorker might react. Because the bad news is much worse.
The logic of the “long depression” is simple. Aging populations, debt, zombification – all of which slow growth.
How many old people and zombies do you need before an economy comes to a halt?
Nobody knows. But the drag from debt is observable and calculable.
Over the last three decades, approximately $33 trillion in excess debt has been contracted – above and beyond the traditional ratio to income – in America alone. And growth rates have fallen in half.
That’s because dollars that would otherwise support current spending are instead used to pay for past spending. Our old debts have to be retired with current income.
The money doesn’t disappear, of course. Some goes to creditors who spend it. Some comes back as capital investment, which is a form of spending. But as credit shrinks, generally, so does the economy.
And that brings us to the impossible situation we’re in now.
In order to get back to a healthy ratio – say approximately $1.50 worth of debt for every $1 in income – you’d need to erase all that excess that has already been contracted. In other words, you’d have to take $1 trillion out of the consumer economy every year for the next 33 years.
It would be the longest and deepest depression in US history.
A Credit Crisis, Complete with Howling, Whining, Finger-Pointing
Take a trillion out of the US economy and you have a 4% decline in GDP. Then, as the economy declines, the remaining debt burden becomes even heavier.
Try to pay down debt and it becomes harder and harder to pay down. You stop buying in order to save money. Your local merchants lose sales. Then they try to cut expenses, and you lose your job.
In other words, no “steady state slump” is possible.
When the credit cycle turns, it will not be a gentle slope, but a catastrophic cliff… a credit crisis, complete with howling, whining, finger-pointing… and more clumsy rescue efforts from the feds.
As we said yesterday, there are two solutions to a debt crisis. Inflation or deflation.
Central banks can cause asset price inflation. But it is not always as easy as it looks. Consumer price inflation requires the willing cooperation of households.
With little borrowing and spending from the household sector, credit remains in the banks and the financial sector. Asset prices soar. Consumer prices barely move.
US consumer price inflation over the last 12 months, for example, was approximately zero.
The assumption behind the “long depression” hypothesis is that central banks cannot or will not be able to cause an acceptable or desirable level of consumer price inflation. As a result, the economy will be stuck with low inflation, low (sometimes negative) growth and low bond yields.
But what about deflation? If inflation won’t reduce debt, why not let deflation do the job?
More tomorrow…
Regards,
Bill

 Quotable
“Only those who will risk going too far can possibly find out how far one can go.”
T. S. Eliot
Commentary & Analysis
The Greeks used to call it “hubris”
Proudly spending other people’s money with little in the way of accountability might be considered hubris by those of a more conservative bent. It seems socialists think that represents “justice.” From the Financial Times this morning:
The Greek parliament has approved a law proposed by the leftwing Syriza-led governmentoverturning civil service reforms by the previous government aimed at streamlining the country’s inefficient public sector.
The legislation, which was passed on Tuesday night, called for the rehiring of about 13,000 civil servants whose jobs were cut in an overhaul of the public administration agreed with bailout lenders. It also eliminated annual evaluations for civil servants and promotions based on merit.
I just love that last part—let’s forget about that “merit” thing. Is this supposed to instill confidence for anyone willing to lend Greece money?
The euro remains supported on rising German yields, as you can see in the chart below. But one wonders just how much more Eurozone grownups can stand. If German yields start to fall again, it likely means Greek risk is intensifying, i.e. players moving back into German paper to hide…


-
I know Mike is a very solid investor and respect his opinions very much. So if he says pay attention to this or that - I will.
~ Dale G.
-
I've started managing my own investments so view Michael's site as a one-stop shop from which to get information and perspectives.
~ Dave E.
-
Michael offers easy reading, honest, common sense information that anyone can use in a practical manner.
~ der_al.
-
A sane voice in a scrambled investment world.
~ Ed R.
Inside Edge Pro Contributors

Greg Weldon

Josef Schachter

Tyler Bollhorn

Ryan Irvine

Paul Beattie

Martin Straith

Patrick Ceresna

Mark Leibovit

James Thorne

Victor Adair