
Timing & trends
 This complimentary live webinar starts at 11am Pacific time Saturday following the show. ~ Ed.
For over 25 years, Stockscores founder Tyler Bollhorn has been picking winning stocks using one simple concept.
During this webinar, you will learn his secret for finding the hot stocks of the future and get a demonstration of the tools he has built to find them.

USDCAD Overnight Range 1.2048-1.2142
The highly anticipated US (and Canadian) employment reports were greeted with a resounding “meh”. NFP was right on consensus and the unemployment rate is 5.4%. EURUSD rose and fell and is currently back to its pre-release level.The Canadian report was worse than expected, which was actually expected, shedding 19,700 jobs. The details revealed that the data isn’t as bad as it looks with full-time gaining 46,900 jobs. All the losses were part-time. USDCAD trading was erratic but has settled close to where it was before the news.
The overnight session ahead of the US non-farm payrolls release is usually quiet and for most currency pairs, that was the case. But not for Sterling.The Conservative party surprised pollsters and squeaked out a majority win. GBPUSD rallied from 1.5265 to over 1.5500 before drifting lower on profit taking. EURUSD dropped as EURGBP trades were reversed.
In Asia, the RBA Monetary Policy Report contrasted with Tuesday’s RBA statement. On Tuesday, the bias toward cutting rates was omitted while some forecasts and statements in the MPR heightened rate cut risks. AUDUSD fell and then weak Chinese trade data added to its woes.
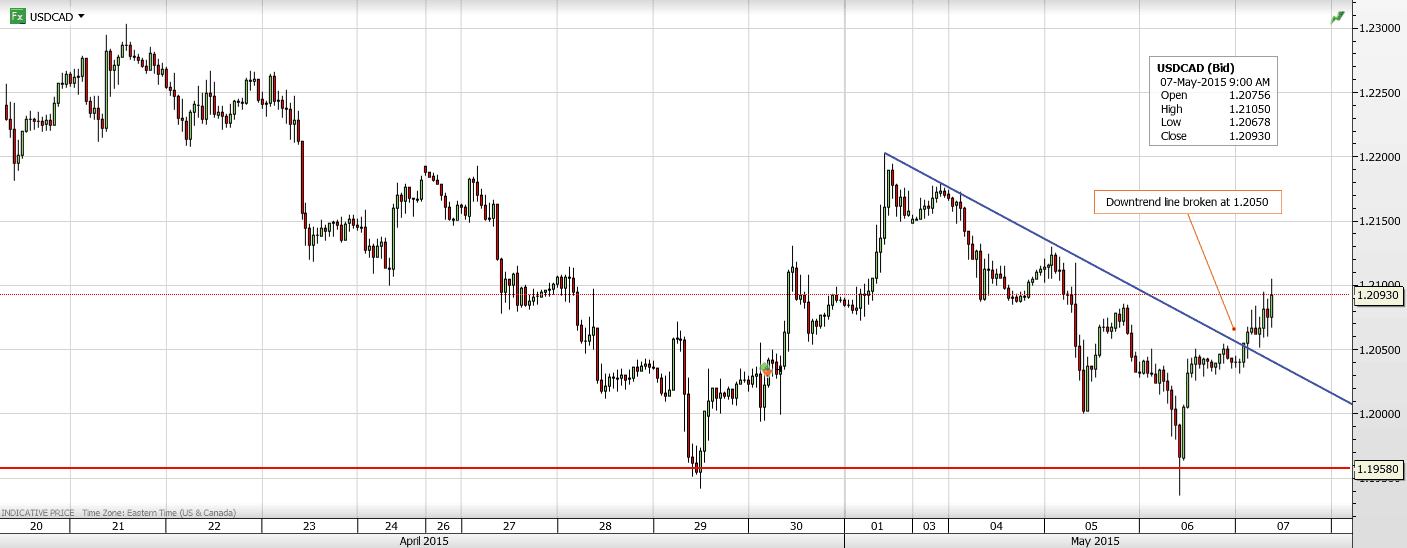
USDCAD technical outlook
The intraday technicals are modestly bullish while trading above 1.2090 supported by yesterday’s breach of resistance at 1.2050 looking for a break of the April downtrend line (Currently 1.2160) to extend gains to 1.2270. If 1.2160 caps the upside, expect additional 1.1960-1.2160 consolidation.
Today’s Range 1.2080-1.2160
Chart: USDCAD 4 hour with intraday downtrend shown

The disconnect in the US stock market just keeps getting bigger
A new Bank of America Merrill Lynch survey published Thursday finds that US investors have pulled $99B out of equities year to date — including net outflows in 11 of the past 12 weeks — despite stock prices continuing to break new record highs.
This week also saw the biggest outflows from equity ($17.2bn) and high-yield bond funds ($2.6bn) so far this year. This data follows a similar report from BAML last month which showed investors pulled $79 billion from the stock market this year and 9 of 10 weeks to that point.
And as this imbalance grows, Bank of America writes that the risk of something we haven’t seen in the market in years will continue to grow: a correction.’


“Suddenly, everyone’s worried about the bond market. The yield on the 10-year Treasury rose seven times in eight days. On Wednesday and Thursday, the yield got to 2.25%, which is the highest in two months.
Of course, some of this needs to be put in context. Bond yields are hardly high; they’re just higher than where they were a few weeks ago, and that was pretty darn low. The 10-year yielded 3% in early 2014, and we’re still well below that.
The 10-year yield gained 31 basis points in eight sessions. That’s enough to get people’s attention. This may sound like blasphemy, but I think some of the strength in bonds is due to a stronger economy. The evidence isn’t in just yet, but I suspect the bond market is already placing its bets.
GDP for Q1 was bad. This week’s trade data indicates that the revisions will be even worse. In fact, it’s very likely that Q1 was negative. But that data is already somewhat aged. The first quarter ended more than five weeks ago. The recent initial jobless claims have been quite strong. These are some of the lowest numbers we’ve seen in decades.
We’re also seeing that commodity prices are on the rise. Oil, in fact, has been hot. On Wednesday, West Texas Intermediate got as high as $62.58 per barrel. That’s up $20 per barrel from the March low. (Anyone else remember in February when Citigroup said oil could fall to $20 per barrel? Yeah, me neither.)
The sour mood for bonds has been mirrored in the stock market by an increase in cyclical stocks. The chart below shows how the relative strength of Tech Stocks (XLK, black line) has closely followed the path of the 10-year Treasury yield (blue line). You can see it’s a pretty close fit.”

….read more HERE
Today’s videos and charts:
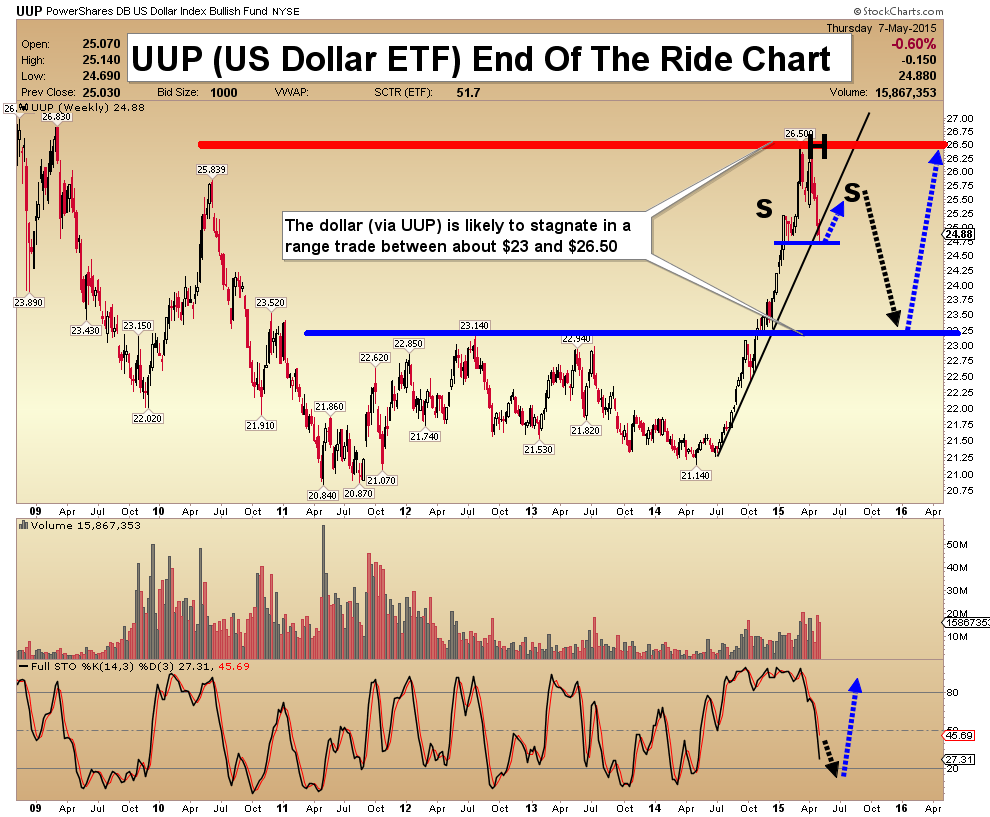
UUP (US Dollar ETF) End Of The Ride Video Analysis
Gold Range Trade Bull’s Eye Video Analysis
Silver Range Trade Bull’s Eye Video Analysis
GDX Jobs Report Influence Video Analysis
GDXJ New Range Trade Video Analysis
Junior Metal Stocks Bull Volume Video Analysis
Here are some more junior stocks that are showing very interesting action on their price and volume charts:
More Junior Metals Stocks Bull Volume Video Analysis
Thanks,
Morris
Unique Introduction For Money Talks Readers: Send me an email to trading@superforcesignals.com and I’ll send you 3 of my next Super Force Surge Signals free of charge, as I send them to paid subscribers.
Thank you!

-
I know Mike is a very solid investor and respect his opinions very much. So if he says pay attention to this or that - I will.
~ Dale G.
-
I've started managing my own investments so view Michael's site as a one-stop shop from which to get information and perspectives.
~ Dave E.
-
Michael offers easy reading, honest, common sense information that anyone can use in a practical manner.
~ der_al.
-
A sane voice in a scrambled investment world.
~ Ed R.
Inside Edge Pro Contributors

Greg Weldon

Josef Schachter

Tyler Bollhorn

Ryan Irvine

Paul Beattie

Martin Straith

Patrick Ceresna

Mark Leibovit

James Thorne

Victor Adair