
Timing & trends
 Earlier this week, I had the pleasure to appear on Jim Puplava’s Financial Sense Newshour radio program and discuss the state of the gold market. Along with my peers John Doody of the Gold Stock Analyst and Ross Hansen of Northwest Territorial Mint, I shared my thoughts on how we arrived in the current bear market, what factors might help us get out of it and the role real interest rates play in prices.
Below I’ve highlighted a few of my responses to Jim’s questions.
Q: Let’s begin with the bear market that began in 2011. Two questions I’d like you to answer. Number one: What do you believe caused it? Number two: Do you think this is cyclical or a secular bear market?
A: As I often say, two factors drive gold: the Love Trade and the Fear Trade.
In 1997 and 1998, the bottom of the emerging market meltdown took place. Four years later, we saw China and Asia starting to take off and GDP per capita rise. This is an important factor in this whole run-up that I would characterize as the Love Trade. A strong correlation is rising GDP per capita, and in China, India and the Middle East, they buy gold and many gifts of love.
We saw the Fear Trade starting to take place after 9/11. The biggest factor behind the Fear Trade is negative real interest rates. So when you had both—negative real interest rates and rising GDP per capita in the emerging countries—you had gold demand going to record numbers.
At the very peak of 2011, the dollar had just been basically downgraded by Moody’s and we had negative interest rates on a 10-year government bond. It was a record negative real rate of return, like in the ‘70s. You saw this spending from the Fear Trade, but this Love Trade was in negative real interest rates.

Since then, the U.S. has gone positive. But we’re seeing that in Europe, gold is taking off in euro terms, and in Japan it’s taking off in yen terms. They’re running at negative real interest rates the way we were on a relative basis up to 2011.

Q: So would you define this bear market as a cyclical bear market, a correction in a long-term trend, or would you define it as secular very much in the way that we experienced the price of gold between, let’s say, the 1980s and 1990s?
A: I think that we’re wrestling with something else. When we look at the other basic metals, what drives the demand for iron, copper, anything that makes steel? It’s fiscal policies. Huge infrastructure spending and fiscal policies. What’s happened since 2011—and after the crash of 2008 but particularly in 2011—is that when the G20 central bankers get together, they don’t talk about trade. It’s all about tax and regulation. They have to keep interest rates low to try to compete, to try to get exports up, to drive their economies. That is a big difference on the need for all these commodities, and it seems to have ended the bull market. Until we get global fiscal policies up and increase infrastructure building, then I have to turn around and look the other way, and say it’s going to take a while.
I do think that gold is going through a bear market. A lot of it has to do more with the central bankers and everything they try to do to discredit gold as an asset class, at the same time try to keep interest rates low to keep economic activity going strong. That’s been a much different factor in driving the price of gold.
The other thing that’s been fascinating is this shift of gold from North America to Switzerland to China. The Chinese have a strategy for the renminbi. Not only do they have 200 million people buying gold on a monthly program throughout their banking system, but the government is buying gold because it needs to back the renminbi to make it a world-class currency of trade.

Q: Explain two things: one, why we never saw the hyper-inflation that people thought we were going to see with the massive amounts of quantitative easing (QE), and two, investor preferences changing from hard assets into stocks.
A: Well first of all, a lot of money didn’t really go directly into the economy. We never had a huge spike in credit supply in 2011, ’12, ’13. Only in ’14 did we start to see it really pick up.

We never got this big inflation some expected because the money is so difficult, outside of getting a car loan or an extension on a house. Even Ben Bernanke, after he left the Federal Reserve, had trouble refinancing his house following his own procedures. It’s extremely onerous to get a loan.
I think the biggest part is to follow the money. And where is the money going? It’s showing up in stocks. When I look at gold stocks, it’s amazing to see that the indexes are down since 2011, but a basket of the royalty companies is positive. So why is money finding its way to them? What are the factors driving that? Well, not only do they have free cash flow, but they also have a higher profit margin and they’ve been raising their dividends. Franco-Nevada again just raised its dividend. Since 2011, the dividend yield on Franco-Nevada and Royal Gold has been higher than a 5-year government bond and many times higher than a 10-year government bond. So money all of a sudden starts going for that yield and growth.
Q: What’s happened to the industry since the downturn began in 2011?
A: Well, when you take a look at the big run we had until 2006, we had very strong cash flow returns on invested capital. We had expanding free cash flow. And then a lot of the mining companies lost their focus on growth on a per-share basis. They kept doing these acquisitions, which made a company go from “$1 billion to $2 billion in revenue.” However, the cost of that meant that there was less gold per share in production and there were less reserves per share. You had this run-up in the cost for equipment, for exploration, for development. The result was you had seven majors lose their CEOs. And in the junior to mid-cap size, you probably had another 20 in which management was thrown out.
The new management is much more focused on capital returns. They have to be. Otherwise they get criticized. That will hold a lot of these managements accountable, and I think that’s very healthy. And now it’s starting to show up that the returns on capital are improving for several of these companies.

Q: What would you be doing with money right now if you were to be in the gold market? How much would you put in the gold market? How would you have that money invested.
A: I’ve always advocated 10 percent and rebalance every year. Five percent would go into gold bullion, coins, gold jewelry—you travel around the world and you can buy gorgeous gold jewelry at basically no mark-up compared to the mark-up on Fifth Avenue. The other 5 percent is in gold stocks, and if it’s a basket of these royalty companies, I think you’ll do well over time, and you rebalance.
If not, then you go to an active manager, like we have. Speaking from a buyer’s position, Ralph Aldis— portfolio manager of our Gold and Precious Metals Fund (USERX) and World Precious Minerals Fund (UNWPX)—is a TopGun ranked in Canada as an active manager.
Q: Explain your caution in terms of gold in the percentage you recommend.
A: I’ve always looked at gold as being a hedge from the imbalance of government policies. Having that 10-percent weighting and rebalancing every year might help protect your overall portfolio. There are many studies going back 30 years that show that rebalancing helps.
It’s also advisable to put half your money in dividend-paying blue chip stocks that are increasing their revenue. When there are great years in the stock market, people often take some profits. And when gold’s down, as it is now, it might be time to put money in gold and gold equities.
For more, listen to the entire interview.
Please consider carefully a fund’s investment objectives, risks, charges and expenses. For this and other important information, obtain a fund prospectus by visiting www.usfunds.com or by calling 1-800-US-FUNDS (1-800-873-8637). Read it carefully before investing. Distributed by U.S. Global Brokerage, Inc.
Past performance does not guarantee future results.
Gold, precious metals, and precious minerals funds may be susceptible to adverse economic, political or regulatory developments due to concentrating in a single theme. The prices of gold, precious metals, and precious minerals are subject to substantial price fluctuations over short periods of time and may be affected by unpredicted international monetary and political policies. We suggest investing no more than 5% to 10% of your portfolio in these sectors.
Diversification does not protect an investor from market risks and does not assure a profit.
There is no guarantee that the issuers of any securities will declare dividends in the future or that, if declared, will remain at current levels or increase over time. Note that stocks and Treasury bonds differ in investment objectives, costs and expenses, liquidity, safety, guarantees or insurance, fluctuation of principal or return, and tax features.
The S&P 500 Stock Index is a widely recognized capitalization-weighted index of 500 common stock prices in U.S. companies.
Investing in real estate securities involves risks including the potential loss of principal resulting from changes in property value, interest rates, taxes and changes in regulatory requirements.
Fund portfolios are actively managed, and holdings may change daily. Holdings are reported as of the most recent quarter-end. Holdings in the Gold and Precious Metals Fund and World Precious Minerals Fund as a percentage of net assets as of 3/31/2015: Allied Nevada Gold Corp. 0.00%; Barrick Gold Corp. 0.06% in Gold and Precious Metals Fund, 0.06% in World Precious Minerals Fund; The Coca-Cola Co. 0.00%; Franco-Nevada Corp. 0.10% in Gold and Precious Metals Fund, 0.01% in World Precious Minerals Fund; Market Vectors Gold Miners ETF 0.00%; Market Vectors Junior Gold Miners ETF 0.00%; Nestle SA 0.00%; Newmont Mining Corp. 1.10% in Gold and Precious Metals Fund, 0.06% in World Precious Minerals Fund; Osisko Gold Royalties Ltd. 7.13% in Gold and Precious Metals Fund, 10.29% in World Precious Minerals Fund; The Proctor & Gamble Co. 0.00%; Royal Gold Inc. 2.52% in Gold and Precious Metals Fund, 1.00% in World Precious Minerals Fund; SPDR Gold Shares 0.37% in Gold and Precious Metals Fund; Yamana Gold Inc. 0.87% in Gold and Precious Metals Fund, 0.23% in World Precious Minerals Fund.
All opinions expressed and data provided are subject to change without notice. Some of these opinions may not be appropriate to every investor. By clicking the link(s) above, you will be directed to a third-party website(s). U.S. Global Investors does not endorse all information supplied by this/these website(s) and is not responsible for its/their content.

 More signs this week that one metal may be a developing sleeper story. With tight supply and shifting market fundamentals coming together (quietly) to create a potential bull run.
That’s in palladium.
Platts reports that precious metals experts GFMS have just flagged a major supply shortage in the global palladium market. With the group estimating that this metal was in deficit by 1.58 million ounces in 2014.
GFMS further noted that this was one of the worst shortages in the palladium market for years. With the group calling last year’s deficit “the most severe market imbalance for more than a decade”.
Notably, analysts here estimate that the palladium market has now been in deficit since 2007. Meaning that we’ve seen seven years of demand running ahead of supply.
That’s a situation unique amongst the metals complex today. With no other commodities having seen a supply shortage running anywhere close to this length.
All of which suggests that major opportunities may be unfolding here. With tightening supply creating the potential to drive prices higher — as with the 30% gains palladium enjoyed in mid-2014, when strikes in the South African mining sector threatened one-third of world supply.
Prices have since levelled off — falling from a high of over $900 per ounce in August 2014, to a current level near $780. But any new threats to supply could trigger another run, given the precarious state of the market.
Threats like attempts by Russia to corner the market with buying through special investment funds — a strategy that’s recently been put forward by top players in that country’s mining industry (see “Is This $2 Billion Buy A Sign Of Opportunity In Palladium?” – Pierce Points: April 9, 2015).
The big question is: how to position for such a move? Toward that end, members of the Pierce Points Discovery Network will be receiving new research next week on global project opportunities in the PGM space. (If you’re not already a member of the Discovery Network, simply apply by updating your subscription preferences.)
Watch for these observations on how to profit from this undercurrent trend — and for more events affecting supply in the global palladium space, particularly in top producers Russia and South Africa.
Here’s to scarcity,
Dave Forest

Bond Bubble Bursting?
by David Chapman

Larger Image – Source: www.barchart.com
What is going on with bonds? Over the past few weeks, it appears that bonds are having a massive heart
attack. Just a few short weeks ago it appeared that the German Bunds (German bonds are called bunds) were about to plunge under 0%. After all, there was already upwards of $2 to $3 trillion of debt in the Euro zone trading at negative yields. The ECB’s €1 trillion QE program had sparked a huge run into bonds. The market was effectively front running the ECB. That in turn was creating liquidity problems in the bond market. German 10-year yields were pushed to a low of around 0.05%.
It seems that buyers suddenly balked at pursuing bonds. Last week there was a poor French OAT auction (French bonds are called Oats). The ECB wanted yields higher. Oil prices rose sparking some inflation fears. As well, there were faint signs of economic life in the Euro zone. Bonds prices suddenly dropped and in a “heart flash” 10-year German yields backed up to 0.76% (yields move inversely to prices). Overall losses were only €8 Euros or roughly €80,000 on a €1 million bond. It could have been worse.
 Larger Image – Source: www.stockcharts.com
The iShares Barclays 20+ year Treasury Bond Fund (TLT-NYSE) has fallen almost $20 since peaking back in January 2015. That is only about 14% but it has wiped out all of the gains of 2015. 30-year US Treasury bonds have fallen roughly $13 while the 10-year US Treasury note is off roughly $4. Numerous bonds have given intermediate sell signals. It has also caught a number of market participants unexpected.
On a yield basis, the 10-year Treasury note has gone from a low of 1.68% back in January to 2.28% today. The 30-year Treasury bond has gone from 2.25% to 3.07% today in the same period. The rise in yields has seen a rush out of the long end of the yield curve into the short end of the yield curve where US Treasury rates are almost zero for maturities under 3 months and are still only 0.60% out to two years.
Yes, one can get higher yields by buying corporate bonds but consider that credit quality has deteriorated since the crash of 2008. Corporate bond debt issuance in the US today sits at about $1.4 trillion of which $300 billion could be considered junk bonds. Back in 2006/2007, some 28% of corporate debt issuances were B-rated but in the past two years over 70% of debt that has been issued is B-rated. More debt has been issued and standards have fallen.
The world is awash in debt. The McKinsey Global Institute study of 2014 titled “Debt and (not much) Deleveraging” noted that global debt is up 40% since 2007 to almost $200 trillion. Given those numbers were back in 2014 the total could be higher now. Globally debt as percentage of GDP has gone from 269% in 2007 to 286% in 2014. The global debt market is huge compared to the global stock market by a factor of roughly 3X. By comparison, the global gold market is worth roughly only $6.6 trillion at $1,200/ounce.
The global debt problem and the recent drop in bond prices has caught the attention of numerous newspapers and other market pundits. The Globe & Mail, Report on Business has been featuring a series of articles on debt. The latest is found in the May 14, 2015 edition of ROB entitled “A world awash in public debt: The $58 trillion problem”. The Globe is also exploring the dependence on debt for both households and institutions and the looming risks of debt and Canadians addiction to cheap money. This series can be found at http://www.theglobeandmail.com/report-on-business/international-business/sovereign-debt/article24417753/
Trying to find reasons as to why global bond markets have suddenly sold off has left analysts and market pundits flummoxed. After all and especially because of ongoing QE in the Euro zone and Japan weren’t bond yields supposed to go lower and interest rates stay low? The US ended its QE back in October 2014. Bond yields instead of moving higher because of the end of QE in the US, instead moved even lower. Oh yields did wobble and the 10-year Treasury note rose as high as 2.38% in November but by the end of January 2015 the 10-year had fallen to 1.68%.
Given the QE programs, maybe everyone thought that yields would fall forever. Yields had fallen to unheard of levels especially in the Euro zone where it was estimated that over $2 trillion of debt was trading at negative yields. Banks throughout the Euro zone were paying negative interest rates and it was the central banks that were leading the way to push yields below zero. There was a cost to leaving your money in the bank. The downward trend in yields trade became overly crowded. No one it seems thought that yields could rise. Until now that is.
But has the jump in yields been really that drastic? When one puts it into a long-term perspective the current bond drop barely looks like a blip. Bond prices have been falling since a major bottom was seen in October 1981. For 34 years bond prices have been moving relentlessly higher. However, they have been interrupted at times by some vicious bond bears. These bond bears appear to occur roughly every 6 to 7 years. Following the 1981 low important bond lows were seen in 1987, 1994, 2000, 2007 and most recently in late 2013, early 2014. Ray Merriman, a financial forecaster www.mmacycles.com has noted the possibility of a six year bond cycle. The six-year bond cycle is a part of an 18-year bond cycle. Again using the low of October 1981 as the start point there was an important bond low in 2000. The next 18-year cycle low is due sometime into 2019-2021.

Larger Image – Source: www.stockcharts.com
With the 18-year cycle breaking down into three cycles of six years, bonds would appear to be in their third and final six-year cycle based on the last 18 year cycle being in 2000. It is possible that bonds have made their top for the current six-year cycle. The six-year cycle itself breaks down in either two 3-year cycles or three 2-year cycles. It could be that the bonds are falling into a 2-year cycle low that could bottom sometime within 4 months of April 2016 or if a longer 3-year cycle low the low would be seen within six months of April 2017.
It is worthwhile to examine what happened during previous six-year cycle lows.
- The 1987 bond bear got underway in March 1987 and culminated in October 1987 coinciding with the 1987 stock market crash that saw the Dow Jones Industrials (DJI) fall roughly 40% from its August 1987 top. Bonds fell roughly $20 from the top in March 1987 to the October 1987 low.
- The 1994 bond bear got underway in September 1993 and made its final bottom in November 1994. The bond collapse occurred during a period when the US$ Index was falling sharply. The US stock market faltered throughout 1994 but there was no big drop. The DJI fell only 12% from a high in early 1994. Bonds fell $26 from the September 1993 top to the November 1994 low.
- The 1999 bond bear got underway in October 1998 and bottomed in January 2000. 1998 saw a stock market bear sparked by an Asian currency crisis and a Russian default. It culminated in October 1998 when the Fed dropped interest rates sharply and flooded the financial system with liquidity in order to prevent a market meltdown as a result of the collapse of the hedge fund Long Term Capital Management (LTCM). The LTCM collapse almost brought down the financial system at the time. Bond prices topped in October 1998 and rose over the next year or so as a result of a strong economy and the Internet/High Tech stock market bubble. Following the bottom in bond prices, the DJI fell 40% over the next two years.
- Bond prices rose irregularly during the first few years of the new century. The Fed once again flooded the financial system with liquidity and lowered interest rates to combat the High Tech/Internet stock market collapse of 2000-2002. This triggered what was known as the housing bubble that topped in 2006. Bond prices topped in June 2005 and fell irregularly for the next two years making their final low in June 2007. Overall bonds fell $14. The fall in bond prices coupled with the collapse of the housing bubble was behind the 2008 stock market panic that saw the DJI lose 55% from October 2007 to the final low in March 2009.
- Prior to the bond market top of 2015, the previous top was seen in July 2012. Bond prices fell $26 from July 2012 to December 2013 with a secondary low seen in April 2014. To date the stock market has not fallen because of the bond bear of 2013. Instead, the stock market has kept on rising seeming to ignore the bond collapse. All previous six-year cycle lows of 1987, 1994, 2000 and 2007 culminated in bear markets for stocks of some degree. The weakest was 1994 and the worst one was the 2008 financial collapse.
It may be that the stock market is not responding to the any hike in interest rates. Or it may be that the stock market is delaying any reaction to a hike interest rates. Everything that is being written about the global debt situation is correct. Upwards of $200 trillion in global debt is not sustainable. The risk of a sovereign debt collapse is high with the most likely candidates being Ukraine and Greece. But Italy is also experiencing considerable debt problems and Japans total debt to GDP is the world’s highest.
The huge amount of debt for governments, corporations and households is a risk and a drag on the global economy. There is little ability to expand debt further as the global economy and in particular the western economies are not growing at a pace that could sustain more debt. All major countries have a higher debt to GDP than they did in 2007 prior to the 2008 financial crisis. China has added the most debt during that period and it too is vulnerable to a debt collapse particularly in its real estate sector. The current debt reports ignore the estimated $100 trillion in unfunded liabilities for the US.
Any rise in interest rates at this time is expected to be contained. There is little economic data suggesting that global economic growth or inflation are about to take off any time soon. That suggests that interest rates could remain subdued for years. That doesn’t prevent periodic rises in interest rates and a collapse in bond prices. The world’s central banks are trapped in what is known as a liquidity trap. No matter how much money they throw at the economy they can’t really decrease interest rates any further. They are already as low as they can go although as is being seen in the Euro zone interest rates are now negative. Monetary policy appears to have become ineffective.
In order to see the ineffectiveness of monetary policy one needs to look no further than Japan. For the past twenty five years Japan has been locked in low growth, low interest rates and seemingly endless injections of QE. The result is that Japan now has the world’s highest debt to GDP ratio and low savings rates. The Euro zone appears to be headed that way. All the western economies are dependent on welfare programs of some degree to maintain the economy. The western economies are aging economies although the US and even Canada are not aging to the extent that Japan in particular and the Euro zone are. The North American economies have exported their jobs to the developing countries that include countries such as China, India and Mexico. These jobs are most likely not coming back.
The recent drop in bond prices appears to be a liquidity problem. Rather than rising interest rates the real risk is that debt collapse occurs due to a sovereign default that in turn triggers contagion and other defaults. A debt collapse is deflationary. A debt collapse in many respects is far more dangerous than a stock market collapse. The debt collapse in 2007 was due to the collapse of the sub-prime mortgage market. It was a classic case of overleveraging. Since that collapse, the debt situation has only gotten worse and the most likely outcome is another debt collapse followed by a stock market collapse.
While gold reacted negatively in to the financial crisis of 2008 falling with the stock market, gold was also the first one “out of the chute” in 2009. From 2009 to the top in 2011 gold prices rose 180%. Despite a three-year bear market correction, gold prices remain up 78% from the 2008 low.
It has been interesting watching the prices fetched by art and other collectables over the past few months. The most recent was the sale of Picasso’s Women of Algiers that sold for a record $179.4 million. Art and collectables have been a hot market. Real estate has also been hot in some countries particularly Canada. The rush appears to be into tangibles as a place to “stash cash”. Art, collectables and real estate have a long history as a store of value despite ups and downs over the years. Both gold and silver also have a long history as a store of value. Could gold and silver experience the kind of price rise that is occurring in the art, collectable and real estate markets?
Bond prices have been falling. But the odds of a major bond collapse is most likely low. The western economies are just too weak to see any huge rise in interest rates. The real risk is more likely a debt default. There have already been a number of corporate debt defaults in China’s overheated real estate market. A sovereign default of either Greece or Ukraine is a real risk. Ukraine is an economic basket case. The global economy is more likely caught in a liquidity trap. In a liquidity trap debt default is a higher risk than for a sharp drop for bond prices.


Dow Versus Gold Book Profits Now Video Analysis
Above & below are today’s videos and charts (double click to enlarge):
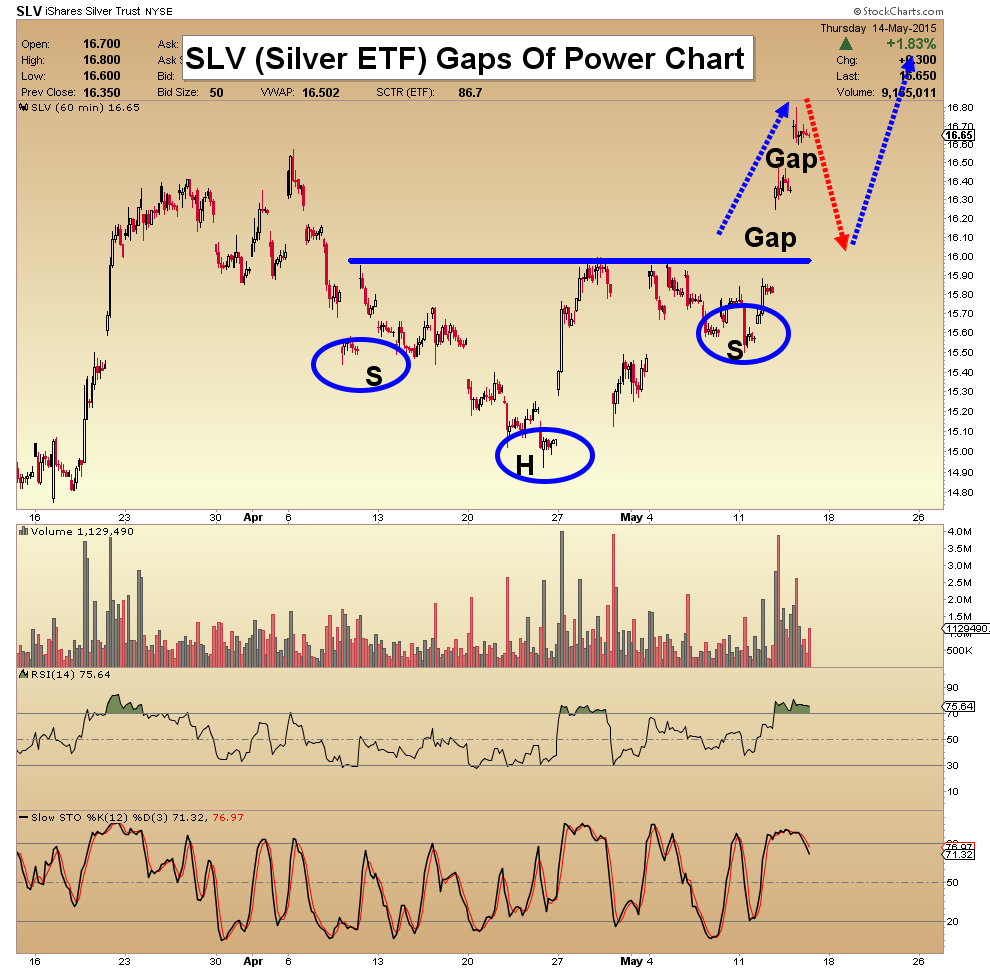
Silver New Range Video Analysis
GDX, GDXJ, & SIL First Target Acquired Video Analysis
Key Junior Gold Stock Volume Spikes Video Analysis
More Junior Stock Charts Of Interest Video Analysis
Morris
Friday, May 15, 2015 Super Force Signals special offer for Money Talks Readers:
Send an email to trading@superforcesignals.com and I’ll send you 3 of my next Super Force Surge Signals free of charge, as I send them to paid subscribers. Thank you!
The SuperForce Proprietary SURGE index SIGNALS:
25 Surge Index Buy or 25 Surge Index Sell: Solid Power.
50 Surge Index Buy or 50 Surge Index Sell: Stronger Power.
75 Surge Index Buy or 75 Surge Index Sell: Maximum Power.
100 Surge Index Buy or 100 Surge Index Sell: “Over The Top” Power.
Stay alert for our surge signals, sent by email to subscribers, for both the daily charts on Super Force Signals at www.superforcesignals.com and for the 60 minute charts at www.superforce60.com
About Super Force Signals:
Our Surge Index Signals are created thru our proprietary blend of the highest quality technical analysis and many years of successful business building. We are two business owners with excellent synergy. We understand risk and reward. Our subscribers are generally successfully business owners, people like yourself with speculative funds, looking for serious management of your risk and reward in the market.
Frank Johnson: Executive Editor, Macro Risk Manager.
Morris Hubbartt: Chief Market Analyst, Trading Risk Specialist.
website: www.superforcesignals.com
email: trading@superforcesignals.com
email: trading@superforce60.com
SFS Web Services
1170 Bay Street, Suite #143
Toronto, Ontario, M5S 2B4
Canada
###
May 15, 2015
Morris Hubbartt
 With gold trading above $1,220 and silver near $17.50, it now appears both of these markets are setting up for massive moves to the upside. Included in the piece below is a key illustration as well as an important first target for the upside advance in the price of gold.
…..read more HERE


-
I know Mike is a very solid investor and respect his opinions very much. So if he says pay attention to this or that - I will.
~ Dale G.
-
I've started managing my own investments so view Michael's site as a one-stop shop from which to get information and perspectives.
~ Dave E.
-
Michael offers easy reading, honest, common sense information that anyone can use in a practical manner.
~ der_al.
-
A sane voice in a scrambled investment world.
~ Ed R.
Inside Edge Pro Contributors

Greg Weldon

Josef Schachter

Tyler Bollhorn

Ryan Irvine

Paul Beattie

Martin Straith

Patrick Ceresna

Mark Leibovit

James Thorne

Victor Adair