
Asset protection
 “In the background the wealthiest 1% are paying astounding prices at auction. Last week for the first time in history, a daily auction at Christie’s brought in over $1 billion. Prices for everything from top New York real estate to Picasso masterpieces are going at new record highs. The big money is preparing for record asset prices, suggesting that the purchasing power of currencies is heading south. The battle for the cheapest currency continues, and the big money is preparing for it. Precious metals and stocks are heading north as investors prepare to retain their purchasing power.”
….continue reading Richards comments on Central Banks On Verge Of Losing Gold War As China To Reveal Its Gold Hoard & One Last Thought On The Massive US Debt HERE

Trading position (short-term; our opinion): Short positions with a stop-loss order at $65.23 are justified from the risk/reward perspective.
On Friday, crude oil gained 0.49% as a weaker greenback supported the price. As a result, light crude bounced off the neck line of a bearish formation. Will we see further improvement in the coming days?
On Friday, the Federal Reserve Bank of New York reported that its Empire State manufacturing index rose less-than-expected (to 3.9, missing forecasts for an increase to 5.00). Additionally, the University of Michigan’s preliminary reading of the consumer sentiment index for May slipped to 88.6 from a final April reading of 95.9, missing analysts’ forecasts for a reading of 96.0. Thanks to these disappointing numbers, the USD Index declined to Thursday’s low, making crude oil more attractive for buyers holding other currencies. As a result, light crude bounced off the neck line of a bearish formation, but will we see higher values of the commodity in the coming week? (charts courtesy of http://stockcharts.com).

On the long-term chart, we see that Friday’s move was too small to be visible (not to mention change anything) from this perspective. As you see crude oil still remains under the key resistance zone (created by the 200-month moving average and the long-term blue line), which means that as long as there is no breakout above this area higher values of the commodity are not likely to be seen and further deterioration is more likely than not.
How Friday’s upswing affect the very short-term chart? Let’s take a closer look at the chart below and find out.

On the daily chart, we see that crude oil extended losses after the market’s open and approached the neck line of the head and shoulders formation. The proximity to this important support encouraged oil bulls to act and resulted in a rebound in the following hours. Despite this move, the commodity is still trading well below the recent high and the previously-broken lower border of the rising wedge. Additionally, Friday’s upswing materialized on tiny volume, which doesn’t confirm oil bulls’ strengths. On top of that, the Stochastic Oscillator generated a sell signal, supporting the bearish case. As a reminder, we saw similar position of the indicator at the beginning of March. Back then, a buy signal generated by the indicator triggered a very short-lived upswing, which erased some of earlier drop. Despite this move, the commodity reversed and declined sharply after a sell signal, which suggests that we could see further deterioration in the coming week (especially when we factor in the gravestone candlestick formation and sell signals generated by the RSI and CCI).
Taking all the above into account, we believe that what we wrote in our Oil Trading Alert posted last Tuesday is still up-to-date:
(…) we can notice a potential head and shoulders formation. If this is the case, and oil bears take advantage of this opportunity, light crude will extend declines and test the strength of the green support zone (created by the Feb highs around $54-$54.24) in the coming days (please note that in this area the size of the downswing will correspond to the height of the formation).
Nevertheless, (…) oil bears will have to push the commodity below the green support line based on the May lows (the neck line of the formation is currently around $58.14) before we see an acceleration of the decline.
On top of that, (…) crude oil broke below the lower border of the rising wedge, which suggests a drop to the green support zone created by the Feb highs (in this area the size of the downward move will correspond to the height of the formation).
Summing up, although crude oil bounced off the neck line of a bearish formation, the commodity still remains under the key resistance zone (marked on the monthly chart), which is also reinforced by the recent highs and the lower border of the rising wedge. This suggests that even if light crude moves little higher from here, the space for further gains will be limited and a breakdown below the neck line of the formation is just around the corner.
Very short-term outlook: bearish
Short-term outlook: bearish
MT outlook: mixed with bearish bias
LT outlook: mixed with bearish bias
Trading position (short-term; our opinion): Short positions with a stop-loss order at $65.23 are justified from the risk/reward perspective.

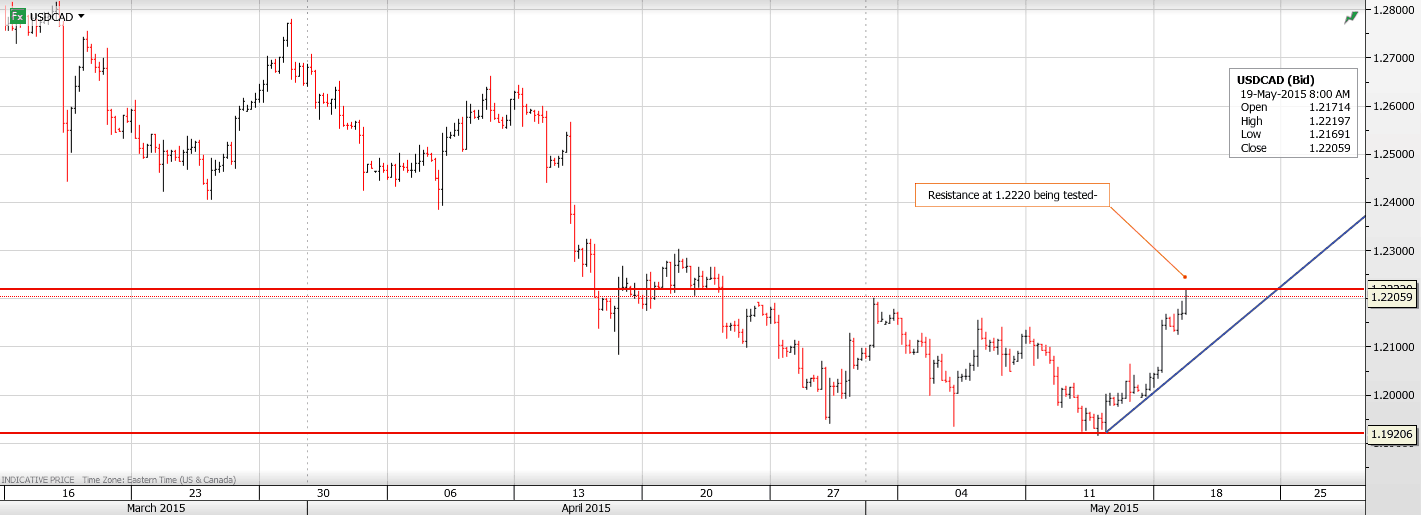
USDCAD Overnight Range (including Monday) 1.2008-1.2215
USDCAD was in demand on Monday and the demand became a stampede by Tuesday, fueled by a broad based US dollar rally, stop-loss buying, and a strong US housing report this morning. (Housing Starts, Actual 1,135K vs forecast of 1,015k) The San Francisco Fed may have encouraged dollar bulls yesterday when they released a report suggesting that US economic growth may be substantially higher than reported. That report, combined with this morning’s news out of Europe that the ECB would front load QE purchases in May and June to compensate for lower volumes in the summer months drove EURUSD lower, from 1.1448 to 1.1130 so far today.
In Asia, AUDUSD dropped following the RBA minutes which provided scope for further rate cuts due to the slowdown in China and weak capital expenditures. At the same time NZDUSD popped when the RBNZ tweaked inflation forecasts upwards. GBPUSD traded lower on the back of a weak EUR and poor inflation data.
The key risk to the Canadian dollar today stems from a speech by BoC Governor, Stephen Poloz, in Charlottetown.
USDCAD technical outlook
The intraday USDCAD technicals are bullish above 1.2150 looking for a break of resistance in the 1.2190-1.2220 area to extend gains to 1.2260 and then 1.2320. However, 1.2220 zone represents strong resistance which has thwarted attempts higher since April 23. If this level breaks, it argues that a short term bottom is in place at 1.1950 and would target 1.2360. For today, USD support is at 1.2150, 1.2120 and 1.2070. Resistance is at 1.2190, 1.2220 and 1.2260.
Today’s Range 1.2160-1.2220
Chart: USDCAD 4 hour with uptrend and resistance noted


Just as ultra-low interest rates start to seem normal, the markets decide otherwise. US 10-year Treasury bonds yielded about 1.9% in April and are now above 2.20%:

And the trend reversal isn’t limited to the US. Across Europe and Asia rates have spiked in the past month. From Bloomberg:

What does this mean? Several things, potentially:
1) Markets tend to reverse when everyone finally accepts that the dominant trend is going to continue. This could be one of those times, as negative rates came to be accepted as inevitable and (for a growing number of deluded statists) actually good, leading traders to anticipate more of the same. In other words, the trade got too crowded.
2) Investors might be losing faith in governments’ ability to maintain the value of even strong currencies like the dollar and Swiss franc, which would make negative-yield bonds double losers. To which one can only respond, “really, you just figured that out??”
3) All the talk of making cash illegal led a critical mass of people to consider the implications and conclude that such a world is not one in which they want to live.
4) It means nothing, just a hiccup in a dominant secular trend that will take interest rates into sharply negative territory world-wide and result in a cashless society where central banks have unfettered ability to peg interest rates, equity prices and pretty much everything else wherever they want.


-
I know Mike is a very solid investor and respect his opinions very much. So if he says pay attention to this or that - I will.
~ Dale G.
-
I've started managing my own investments so view Michael's site as a one-stop shop from which to get information and perspectives.
~ Dave E.
-
Michael offers easy reading, honest, common sense information that anyone can use in a practical manner.
~ der_al.
-
A sane voice in a scrambled investment world.
~ Ed R.
Inside Edge Pro Contributors

Greg Weldon

Josef Schachter

Tyler Bollhorn

Ryan Irvine

Paul Beattie

Martin Straith

Patrick Ceresna

Mark Leibovit

James Thorne

Victor Adair