
Timing & trends
Larger View

The 3D printing industry is no longer just interesting. It has become downright essential for business, and this is a prospect that investors should be aware of.
The statistics are becoming very straightforward. Roughly 75% of all large manufacturing companies and even 59% of small manufacturers have adopted it in some way. The number of jobs posted requiring workers with 3D printing skills has jumped 1,834% in four years, and still 103% year-over-year from 2013 to 2014.
It’s being used in virtually every sector, with five sectors all making up significant spending: automotive (17.3%), aerospace (12.3%), industrial machines (18.5%), consumer products (18.0%), and medical/dental (13.7%).
There’s been no shortage of success stories either. For example, as pointed out in the infographic, Ducati was able to reduce its development time by 20 months for its Desmosedici race bike engine, good for about an 80% increase in efficiency. Genesis Systems created robotic grippers for an 83% lower cost and in much less time.
While these exceptional stories are fairly anecdotal for now, we expect their size and scope to jump significantly as large-scale manufacturers adopt and integrate 3D printing systems into their production cycles.
Original graphic by: Stratasys

….consolidates in subdued trading
USDCAD Overnight Range 1.2175-1.2235
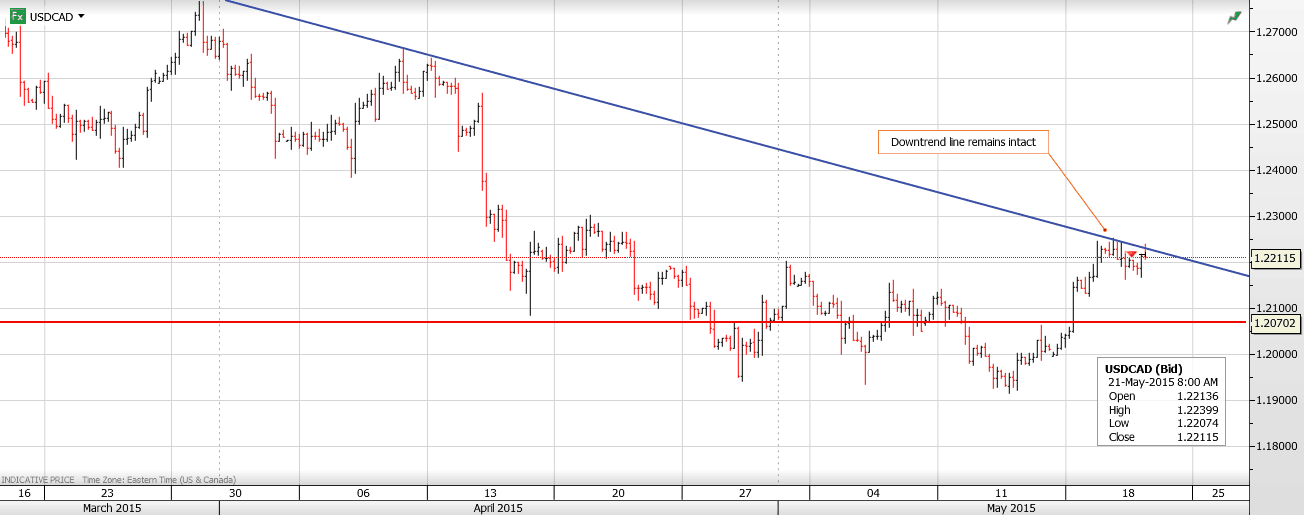
USDCAD drifted higher in early New York trading although the move lacked urgency or conviction and it stalled just ahead of the downtrend line at 1.2240. US Jobless Claims were a tad higher than forecast but the underlying trend is supportive.
The Asian session was quiet. The release of the FOMC minutes yesterday afternoon failed to provide any inspiration to traders and the US dollar gave back prior gains. Even weaker than expected China Manufacturing PMI (Actual 49.1 vs. Forecast 49.3) didn’t spark much trading activity.The Bank of Japan is rumoured to be upgrading its assessment of the economy on Friday but since no change in monetary policy is expected, the currency should be unaffected.
Sterling was the story in Europe. A strong Retail Sales report (Actual 4.7% vs Forecast 3.8, y/y) squeezed GBPUSD shorts and the pair jumped from 1.5530 to 1.5675.
Friday morning brings Canadian Retail Sales and CPI data, both of which are expected to be soft which sets the bar low for an upward surprise.
USDCAD technical outlook
The USDCAD downtrend from the end of March remains intact while trading below 1.2240 with a break of 1.2160 pointing to further losses to 1.2080. A break above the 1.2240-60 area would lead to a test of the 1.2340-60 area. For today, USDCAD support is at 1.2190, 1.2160 and 1.2120. Resistance is at 1.2220-, 1.2240 and 1.2270.
Today’s Range 1.2170-1.2240
Chart: USDCAD 4 hour with downtrend highlighted
published on May 21, 2015, 6:19 AM:
Briefly: In our opinion, speculative short positions are favored (with stop-loss at 2,140, and profit target at 1,980, S&P 500 index)
Our intraday outlook is bearish, and our short-term outlook is bearish:
Intraday outlook (next 24 hours): bearish
Short-term outlook (next 1-2 weeks): bearish
Medium-term outlook (next 1-3 months): neutral
Long-term outlook (next year): bullish
The U.S. stock market indexes were virtually flat on Wednesday, as investors hesitated following recent move up. The S&P 500 index has managed to reach yet another new all-time high at the level of 2,134.72, before closing down 0.1%. The nearest important level of resistance is at around 2,130-2,135. On the other hand, support level is at 2,115-2,120, marked by previous resistance level. There have been no confirmed negative signals so far. However, we can see negative technical divergences:

Expectations before the opening of today’s trading session are slightly negative, with index futures currently
down 0.1-0.3%. The main European stock market indexes have been mixed so far. Investors will now wait for some economic data announcements: Initial Claims at 8:30 a.m., Existing Home Sales, Philadelphia Fed number, Leading Indicators at 10:00 a.m. The S&P 500 futures contract (CFD) trades within an intraday consolidation, following yesterday’s move down. The nearest important level of support is at around 2,110-2,115, marked by recent local lows. On the other hand, resistance level remains at 2,125-2,130, as the 15-minute chart shows:

The technology Nasdaq 100 futures contract (CFD) follows a similar path, as it fluctuates along the level of 4,490. The nearest important level of support is at around 4,480, and resistance level is at 4,500-4,520, among others, as we can see on the 15-minute chart:

Concluding, the broad stock market extended its fluctuations along its record highs yesterday. There have been no confirmed negative signals so far. However, we continue to maintain our speculative short position (2,098.27, S&P 500 index), as we expect a downward correction or an uptrend reversal. Stop-loss is at 2,140, and potential profit target is at 1,980. You can trade S&P 500 index using futures contracts (S&P 500 futures contract – SP, E-mini S&P 500 futures contract – ES) or an ETF like the SPDR S&P 500 ETF – SPY. It is always important to set some exit price level in case some events cause the price to move in the unlikely direction. Having safety measures in place helps limit potential losses while letting the gains grow.
Thank you.


GROWTH
Based on these reports, Gord & John then consider what underlying trends are at work and what it means going forward
Published 05-21-15
43 Minute Video
 Today King World News is pleased to share a fantastic piece which shows 4 of the most astonishing charts of the war in gold, silver and the U.S. dollar. This also includes one truly remarkable illustration that all KWN readers around the world must see.
King World News note: The chart below shows there is still a great deal of “smart money” short positions in the U.S. dollar. They have been covering during the recent plunge in the dollar, but are still historically very net-short.
…..read more HERE

-
I know Mike is a very solid investor and respect his opinions very much. So if he says pay attention to this or that - I will.
~ Dale G.
-
I've started managing my own investments so view Michael's site as a one-stop shop from which to get information and perspectives.
~ Dave E.
-
Michael offers easy reading, honest, common sense information that anyone can use in a practical manner.
~ der_al.
-
A sane voice in a scrambled investment world.
~ Ed R.
Inside Edge Pro Contributors

Greg Weldon

Josef Schachter

Tyler Bollhorn

Ryan Irvine

Paul Beattie

Martin Straith

Patrick Ceresna

Mark Leibovit

James Thorne

Victor Adair