
Asset protection
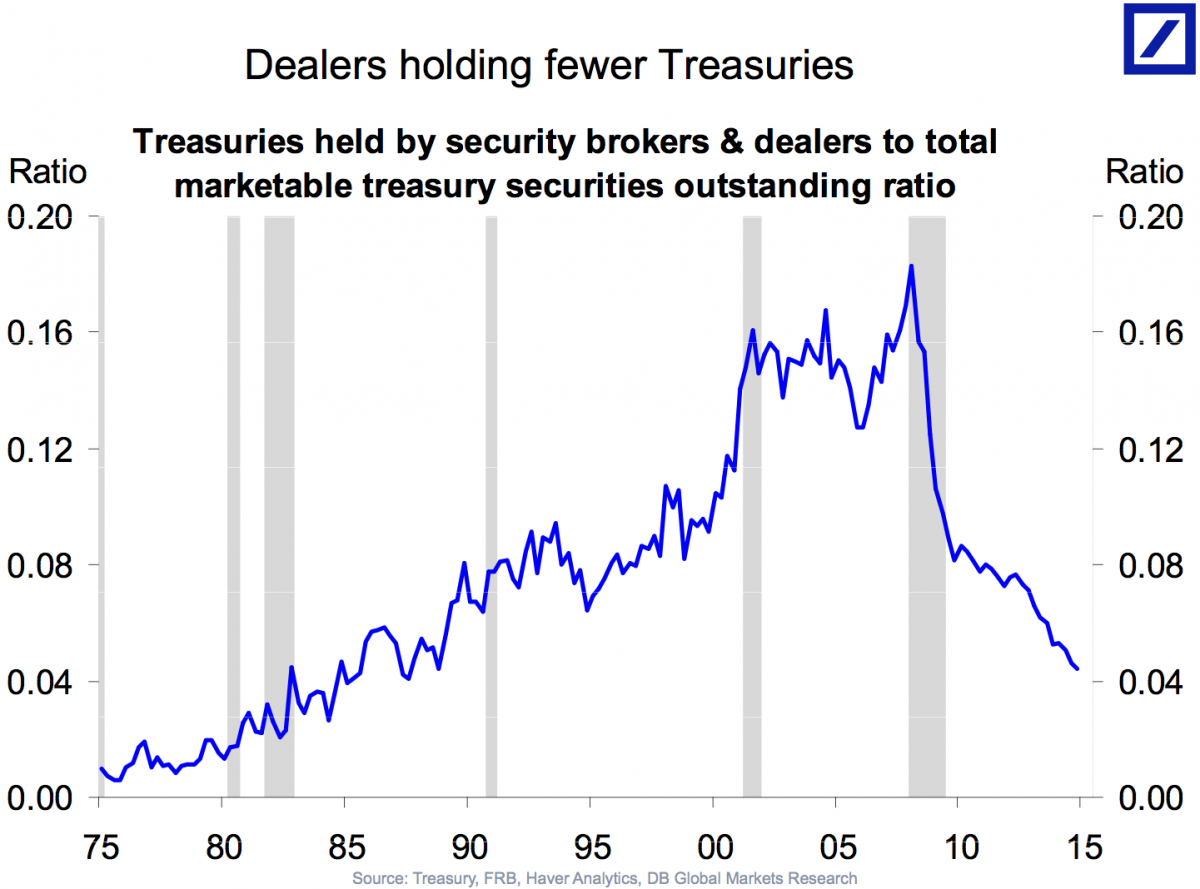
There is chaos in the bond market. There just isn’t enough paper to go around. With the constant threat of the Fed raising rates and yesterdays Bond Market rout triggered by Draghi’s statement that “markets will just have to get used to volatility”, the manifestation of something people in markets have been talking about for the last few months: liquidity is becoming a problem– M/T Ed
….read the article HERE
SEE ALSO posted JUN. 4, 2015, 9:40 AM: There is ‘sheer panic’ in the bond market

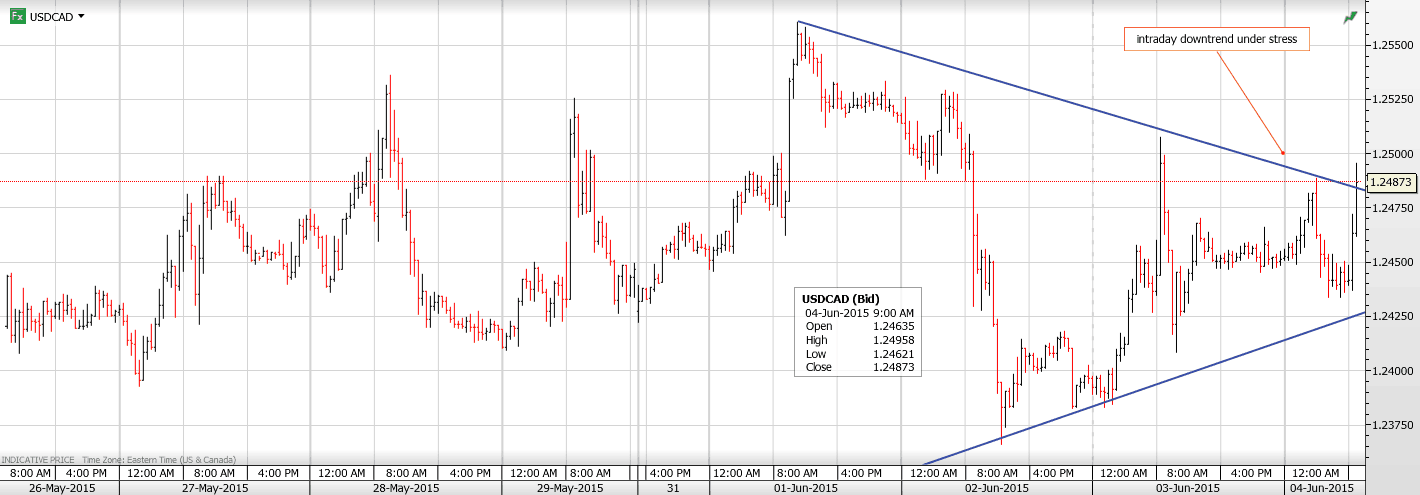
USDCAD Overnight Range 1.2439-1.2495
USDCAD traders were rather indecisive overnight. The Loonie bounced around in a fairly tight range, torn between USDCAD selling on dollar weakness vs. G-10 currencies and EURCAD demand stemming from the rise in EURUSD. However, EURUSD has given back all of the overnight gains following today’s Jobless claims data and USDCAD is close to the overnight peak.
EURUSD is the story. The German bund market is on fire with 10 year yields soaring. The bund sales have led to demand for EURUSD which has turned the short term technicals bullish. The break of the 38.2 % Fibonacci retracement level of the Dec.14-Mar.15 range at 1.1285 targets 1.1775, the 61.8% level.
In Asia, weaker than expected Australian data pushed AUDUSD lower. Over in Japan, comments from a BoJ board member stating that “excessive JPY strength has been corrected” undermined USDJPY.
There isn’t any additional US data to influence trading today but Canada’s Ivey PMI release will create excitement depending on the size of the miss from the 55.5 forecast level. For the most part, traders will mark time until tomorrow’s payrolls reports.
USDCAD technical outlook
The intraday USDCAD technicals are modestly bullish with today’s move back above 1.2490 which targets a re-test of the 1.2550 level. A failure to extend gains above 1.2550 suggests further 1.2410-1.2550 range trading. For today, USD Support is at 1.2460 and 1.2420. Resistance is at 1.2510 and 1.2530
Today’s Range 1.2460-1.2530

 ECB chief said investors should get used to volatility
The bond move is really significant and that is sending huge shock waves through the market and driving investors to reduce their exposure to any risk,” said Philip Lawlor, a partner at London-based Smith & Williamson Investment Management LLP.
He said ECB President Mario Draghi had “injected a huge amount of uncertainty into markets and that is still having a major impact.”
…read the rest of this Wall Street Journal article posted and updated at June 4, 2015 9:40 a.m. ET HERE – M/T Ed
Where Does the Greek Debt Drama End?
In terms of last-minute plot twists and turns, Game of Thrones has got nothing over the ongoing Greek debt drama playing out in Europe.
As the media has constantly pointed out this week, Greece has a $339 million payment due to the IMF on Friday, but Athens has already indicated it will put off making the loan payment if a restructured deal can’t be reached with creditors.
This is followed by another 1.2 billion euro debt payment coming due over the next two weeks. And unless some 11th-hour compromise deal is reached, Greek finance ministers have already hinted that these payments may not be met either without restructuring its debt.
Meanwhile, European Union (EU) finance ministers and the International Monetary Fund (IMF) met in Berlin until well after midnight earlier this week trying desperately to come up with a plan designed to avert a Greek default. But Greece’s prime minister claims the EU’s conditions are “absurd” and “harsh punishment.
 And so it goes … the never-ending Greek bailout saga that’s been dragging on since the 2008 financial crisis continues.
The latest act of this drama has been hanging over financial markets for the past four months as sparring between Athens, the IMF and EU has intensified and deadlines have been missed repeatedly.
But don’t grab your popcorn for this Friday’s big finale just yet.
The sad truth is, the final act of the Greek debt drama may not play out until July, if even then.
You see, missing an IMF payment is not considered a big deal in global financial circles. Many deadbeat creditors have stiffed the IMF including: Cuba, Sudan and Honduras, among others.
But if Athens fails to make good on a 3.5 billion euro debt payment it owes the European Central Bank on July 20, then watch out! central bankers can be nasty when it comes to collections.
And a default would likely cause the ECB to end its emergency lending to Greek banks, a vital $88 billion dollar lifeline that is the only thing
keeping them afloat.
That possibility is already on the radar for investors, who pulled 800 million euro out of Greek banks in just two days last week, which sparked fears of a run on the banks and capital controls in Greece.
But the Greek debt drama is just a side-show compared to the debt explosion that has taken place in global economies since 2007. My friend and very astute money manager Bill Hall recently commented on this as he pointed out the world is more deeply in debt now than at any time in history, as you can see in the graphic below.

Worldwide debt has ballooned by a whopping $57 trillion since the financial crisis. This includes all categories of debt including: government, corporate, financial sector and household debt.
While it’s true that the pace of consumer debt growth has slowed since 2007, it is expanding still. And much of the “slack” has been taken up by an unsustainable increased in government debt, which has expanded at a compound rate of nearly 10% annually!
It’s just astonishing to me that there has been ZERO debt payback over this period. And it’s no surprise why the global economy has been expanding at such a slow pace in recent years – with negative GDP growth in the U.S. last quarter.
In fact, the world is more deeply in debt today than it was then during the worst days of the crisis. And slow growth is the inevitable consequence of this debt overhang.
In the immortal words of Jimmy Buffett, “where it all ends I can’t fathom my friends.”
But for clues about how badly it may all end someday, just keep a watchful eye on the thrilling final act of the Greek debt drama. It’s liable to be more thrilling than Game of Thrones because the truth is always stranger than fiction.
Good investing,
Mike Burnick


-
I know Mike is a very solid investor and respect his opinions very much. So if he says pay attention to this or that - I will.
~ Dale G.
-
I've started managing my own investments so view Michael's site as a one-stop shop from which to get information and perspectives.
~ Dave E.
-
Michael offers easy reading, honest, common sense information that anyone can use in a practical manner.
~ der_al.
-
A sane voice in a scrambled investment world.
~ Ed R.
Inside Edge Pro Contributors

Greg Weldon

Josef Schachter

Tyler Bollhorn

Ryan Irvine

Paul Beattie

Martin Straith

Patrick Ceresna

Mark Leibovit

James Thorne

Victor Adair