
Gold & Precious Metals
Gold and Silver are going to close down for the third consecutive day and the third consecutive week. As we pen this on Friday, Gold bounced from $1162/oz and could close near $1170/oz while Silver traded below $16/oz and may close at $16/oz right on the dot. Both metals are now dangerously close to their final weekly supports and therefore one step closer to an important technical breakdown.
The weekly candle chart for both metals is shown below. Today’s action has yet to be updated. Nevertheless, we can see the clear important weekly support for both metals. For Gold it’s roughly $1150 and for Silver it’s $15.50 to $15.70. The failure of the metals to rally out of their 7-month long bases bodes bearish for the weeks ahead. Furthermore, let’s not forget the relatively high net speculative positions seen in both markets. The COTs will be updated by the time you read this but odds are there are plenty of speculators left to drive the metals to a final breakdown.
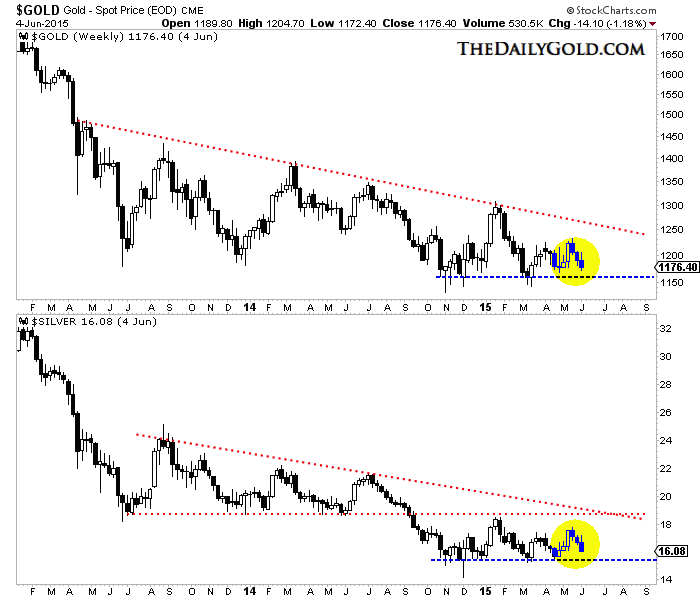
Gold & Silver Weekly
The miners, which peaked before Gold in 2011 and have shown more strength (or less weakness) in recent months
figure to lead the sector out of the coming bottom. At the least, the miners are likely to remain above their lows as the metals break their own lows. In daily terms, Gold is about 2.5% from its low of $1140 while GDX and GDXJ are roughly 13% and 15% from their daily lows. The weekly chart below plots GDXJ and GDX and their weekly support (in blue).

GDXJ & GDX Weekly
Put yourself in position so you can take advantage of the coming breakdown, rather than be a victim of it. We booked profits in our hedges today and will look to reload if the metals rebound next week. We also advise tuning out the super bulls and super bears who are calling for price targets which have no fundamental or technical basis. Extreme targets are an emotional distraction and not actionable.
Mind you, we are huge gold bulls and expect a very sharp rebound to come after this final breakdown runs its course. If and when Gold reaches major support around $1000/oz, it will likely find itself extremely oversold with very negative sentiment. That combination along with strong technical support can produce a big rebound. The coming breakdown in the metals could create one last chance to buy quality junior miners at bargain prices.
Jordan Roy-Byrne, CMT

 With crude oil tumbling nearly 3 percent and continued uncertainty in global markets as investors remain concerned about the U.S. jobs report, today 5 of themost shocking charts of 2015!
The great global distortions that have unfolded as a result of Western central banks embarking on …..continue HERE for the 5 Charts & commentary

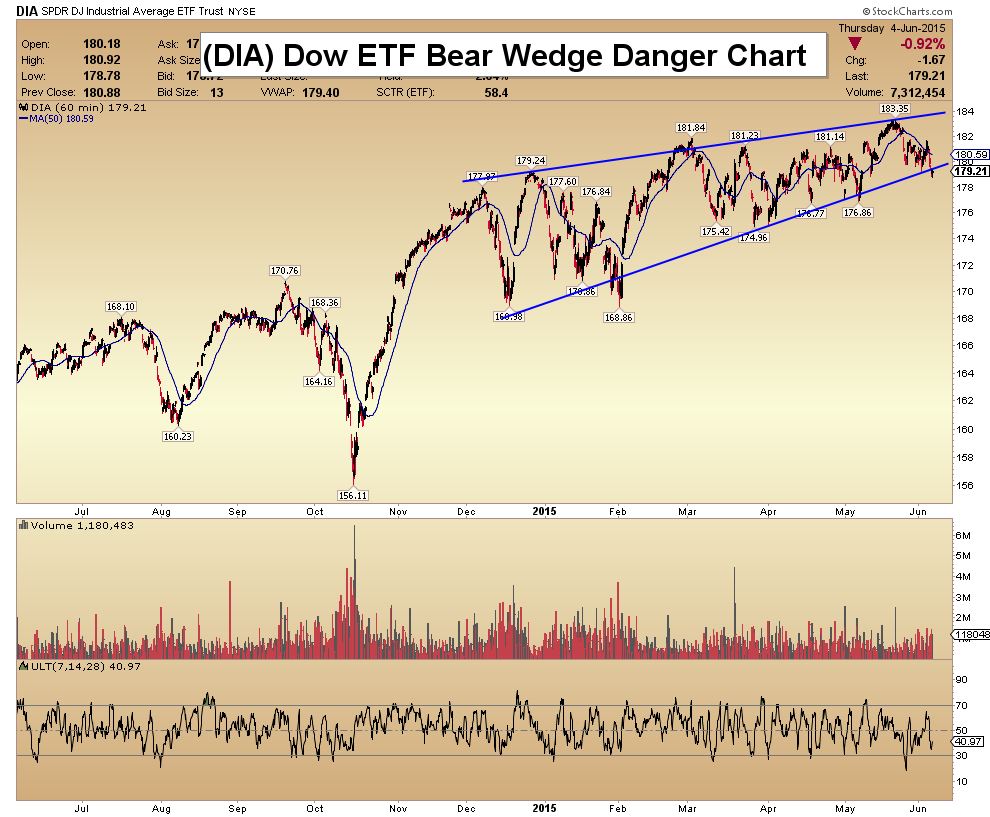
It is said that an image is worth a thousand words. This chart presents a possible roadmap for monitoring the risk of a major peak and bear market by comparing the technical similarities between the prior two market tops and where we are today.

….continue for the 3 signs and summary HERE

Dow & Dollar Charts Of Danger Video Analysis
Gold & Silver Oversold Video Analysis
GDX, GDXJ, & SIL High Octane Volume Video Analysis
Junior Gold Stock Bull Flag Video Analysis
More Key Junior Gold Stocks Video Analysis
Gold & Silver Targets Video Analysis
Thanks,
Morris
Friday, June 5th, 2015 Super Force Signals special offer for Money Talks Readers:
Send an email to trading@superforcesignals.com and I’ll send you 3 of my next Super Force Surge Signals free of charge, as I send them to paid subscribers. Thank you!
The SuperForce Proprietary SURGE index SIGNALS:
25 Surge Index Buy or 25 Surge Index Sell: Solid Power.
50 Surge Index Buy or 50 Surge Index Sell: Stronger Power.
75 Surge Index Buy or 75 Surge Index Sell: Maximum Power.
100 Surge Index Buy or 100 Surge Index Sell: “Over The Top” Power.
Stay alert for our surge signals, sent by email to subscribers, for both the daily charts on Super Force Signals at www.superforcesignals.com and for the 60 minute charts at www.superforce60.com
About Super Force Signals:
Our Surge Index Signals are created thru our proprietary blend of the highest quality technical analysis and many years of successful business building. We are two business owners with excellent synergy. We understand risk and reward. Our subscribers are generally successfully business owners, people like yourself with speculative funds, looking for serious management of your risk and reward in the market.
Frank Johnson: Executive Editor, Macro Risk Manager.
Morris Hubbartt: Chief Market Analyst, Trading Risk Specialist.
website: www.superforcesignals.com
email: trading@superforcesignals.com
email: trading@superforce60.com
SFS Web Services
1170 Bay Street, Suite #143
Toronto, Ontario, M5S 2B4
Canada
###
May 29, 2015
Morris Hubbartt

Perspective
Decades ago, we used some quips attributed to the “trading floor cynic.” After more than fifty years in the markets
and after reading so much of financial history one might become jaded about the markets. Not in these pages. There are very few stock market trading floors anymore and there never were any for the interest rate markets.
But we used to like the trading floor cynic and it might have been an invention of Ed Hart who was on FNN a business channel in Southern California. Sometime in the 1980s, Bob was in LA and while there interviewed with Ed.
The NYSE still has a trading floor, but the “back office” no longer handles paper transactions. The process has become remarkably efficient. As a boom culminated frantic traders would execute orders faster than the tape could record. The tape running late was exciting and worthy of comment. And as speculation went vertical the back office would seize up, which was one of the signs that the boom was over.
And then there were the days of very quiet trade and on one of those days, Ed said that “Trade was so slow that the tape was running fast”.
His other classic was that on the sudden reversal to a major plunge, “The confirmations go out with the margin calls”.
Ed may have passed away and FNN was taken over by CNBC.
Stock Markets
The structure of the overall stock market is still within a big Rounding Top. The NYA has been a good monitor and this Topping has run from last June to recent. Within the structure, sentiment and momentum numbers reached levels seem only at cyclical peaks. Margin employed accomplished a peak last year. And after a natural correction, set a higher high on the latest number which is for March. The second peak is unusual. Complacency builds.
As we have been noting, the NYA pattern is looking like the peak in 2000. In which case, the first step to change will be taking out the 50-Day ma. The defining step will be taking out the 40-Week ema. It is at 10903 and the index is at 11143.
Now why are we so interested in this turndown?
Private stock market participants are more than capable of driving a market to the speculative climax of a bull market. This has been happening and it is accompanied by
the greatest speculation by policymakers in history. Not only have central bankers been buying stocks and bonds, they have been buying all the way up. In the US, this is becoming concerning as Fed officials could be in violation of the “Prudent Man Rule”, which in various iterations dates back to 1830. This essentially instructs that those with fiduciary responsibility 1 should not be buying anything that they would not buy themselves.
That a committee can manage an economy depends upon the concept of a national economy, which does not exist. The other key concept has been that a forced credit expansion by the Fed will force a business expansion. This is a primitive syllogism. As exampled by the Fed, interventionist central banking is a speculative concept. As exampled by the ECB, policy implementation of policy has become fanatical.
This financial bubble has both the private and policy sectors in a highly speculative mode.
On our dedication to archaic, since February we have been monitoring the Dow Theory. It has been in the heads-up mode since March and in an alert mode since the Trannies took out the 50-Day in late March. Taking out the 200-Day on May 11 was a warning. Last week it rose to the 200-Day and has failed. Not good.
A chart follows that takes the warning from the change in credit spreads to a peak in the stock market. It is complicated with a 12-month shift in the indicator, which reversed in late February. We take it as a warning.
In the meantime, we have considered that this stock rally would make it into May and then become vulnerable to the pending reversal in credit spreads.
Are we close to a cyclical peak for the stock market?
This one requires a comment on the economy. In a world of financial engineering and financial manias business activity and the stock market turn down, virtually, together. Examples include 2007, 1929 and 1873. All using NBER determinations of recessions. We have considered that weakening “Macro” numbers since January could be indicating a recession. This would be cyclical but the stock market is on a seasonal rally. At some time they will get together.
Some items have been changing and are no longer supportive. The Treasury yield curve reversed in April. After reaching a targeted high, commodities have turned down. Credit spreads have stopped narrowing.
A positive for the big cap stocks is the firming dollar.
1 The 1946 review include archaic words and meanings from a long lost world. “which men of prudence, discretion and intelligence exercise in the management of their own affairs, not in regard for speculation but in regard to the permanent disposition of their funds.”
Commodities
Iron ore appears to be a late bloomer on our “rotation” move for this year. Last week we asked the question about a possible rotation. The posting for April was 51.15. Within this, the May contract set a low of 49 and is now trading at 59. Cheers and perhaps the relief rally could run for a number of weeks.
Some commodities have met our objectives and have weakened.
Base metals (GYX) rallied from 299 in January to 346 in early May. As noted a couple of weeks ago, the swing from oversold to overbought was huge. As it was for the miners (SPTMN), which rallied from 513 to 832. This has slipped to 731 where it is holding at the 50-Day and 200-Day moving averages.
Metals have taken out the 200-Day at 338 and the 50-Day at 320. Today’s trade is at 313. Crude and oil stocks also accomplished the big swing from very oversold to overbought.
Our May 14th Pivot advised taking the money off the gaming table.
By stages, cotton is declining from its overbought at 68 at the first of May to 63. This is below the 50-Day and holding at the 200-Day moving averages.
Grains (GKX) did not join the “rotation”. The last rally worth mentioning was from the low of 290 in September to 342 in December. That was turned back by the 40-Week ma.
Each rally since has been ended by the declining 50-Day.
At 281 now, it is at a new low for the bear market that started at 570 in 2011.
We monitor commodities for opportunities as well as a guide to the global economy. Also most are relatively free-trading and generate strong trading signals that have generally been reliable. However, the main instruction from chronic weakness in commodities in the face of remarkably belligerent central banking is that their intuitive theories and bureaucratic rituals have not been obtaining the expected robust economy. When will they admit that there is a problem with the theory?
Precious Metals
The sector started with a robust rally out of Christmas. GDX rallied from a low of 17 to 22. This was on our “rotation” theme and it was too much, too soon. It ended at the 200- Day ma. The next low was 17 and the next high was 21.90 in the middle of May. This also ended at the 200-Day.
Our November “Special” on the sector reviewed that for a bottoming process, gold stocks would have to outperform the bullion price. This has replicated the action in gold stocks, but with five attempts to get through the 200-Day. After a good beginning, the inability to break out has been a negative.
Last week’s conclusion was that if it declined below the 50-Day it would indicate the direction of the trend. It did and this is negative.
Also noted last week was that the Daily RSI on the silver/gold ratio had reached 74. Anything towards 80 indicates dangerous speculation and we used this to advise that the play had become “somewhat overdone”.
The 50-Day was taken out and it is again time to lighten up on precious metals stocks. One of the more important items in the gold story is the real price.
We keep track of it through gold’s performance relative to commodities. The rally into January as crude crashed was outstanding. From very overbought Gold/CRB slumped to oversold at the first of May. This has recovered from 5.10 on May 12 to 5.45. This is at the 50-Day and rising through it would be constructive. Above resistance at 5.62 would be significant.
Rising real prices for gold and improving gold mining operating margins have been the long-term feature of post-bubble deflations. It will eventually pull up most gold stocks. We use the gold/silver ratio to anticipate booms and contractions. With the financial boom so far this year, the ratio declined to 69.4 in the middle of the month. This was somewhat oversold on the Daily. The action has been volatile which suggests pending change. The ratio rising above 73 would turn the trend up. Above resistance at 76 to 77 would be a warning to deterioration in credit markets.
Fed GDP Forecasts
- How wrong can you get?
- How often?
- No self-criticism.
- When do they change their concepts to fit reality?

Interesting Indicator

- This is based upon the US corporate credit spread.
- The key is the change in the correlation chart at the bottom.
- This is shifted by 12 months.
- The alert is given when the correlation spikes up and then turns down.
- That occurred on February 25th and the turn down is becoming acute.
Link to May 29, 2015 Bob Hoye interview on TalkDigitalNetwork.com: http://talkdigitalnetwork.com/2015/05/asian-markets-destroying-themselves
Listen to the Bob Hoye Podcast every Friday afternoon at TalkDigitalNetwork.com

-
I know Mike is a very solid investor and respect his opinions very much. So if he says pay attention to this or that - I will.
~ Dale G.
-
I've started managing my own investments so view Michael's site as a one-stop shop from which to get information and perspectives.
~ Dave E.
-
Michael offers easy reading, honest, common sense information that anyone can use in a practical manner.
~ der_al.
-
A sane voice in a scrambled investment world.
~ Ed R.
Inside Edge Pro Contributors

Greg Weldon

Josef Schachter

Tyler Bollhorn

Ryan Irvine

Paul Beattie

Martin Straith

Patrick Ceresna

Mark Leibovit

James Thorne

Victor Adair