
Gold & Precious Metals
This is a chart every gold investor needs to see. While the gold mining industry works harder every year to produce the highly sought-after monetary metal, its overall productivity continues to decline. Actually, decline is too soft of a word to describe what’s taking place in the world’s leading gold producers.
If we look at the at the top five gold producers since 2005, their productivity deteriorated a stunning 50% since 2005. In 2013, the top five gold producers (Barrick, Newmont, AngloGold, GoldCorp & GoldFields) consumed the most diesel ever:

In just nine years, the top five gold producers nearly doubled their diesel consumption from 320 million gallons (MG) in
2005 to 591 MG in 2013. I haven’t updated these figures for 2014, because most of the companies haven’t released their figures for 2014 (found in their Sustainability Reports). The reason I am posting this information on 2013’s figures now… I failed to update some of this information last year.
Here is the breakdown of the individual companies diesel consumption:
Total 2013 Diesel Consumption
Barrick = 220 million gals
Newmont = 179 million gals
AngloGold = 95 million gals
GoldCorp = 65 million gals
GoldFields = 38 million gals
So, why is this such a big deal. Well, if we look at the next chart, it puts it all into perspective:

The top five companies diesel consumption per ounce of gold produced doubled from 12.7 gallons per oz (gal/oz) in 2005 to 25.8 gal/oz in 2013, while production declined from 25.2 million oz (Moz) to 22.9 Moz respectively. This has everything to do with decline of average gold yield from the group which fell from 1.7 grams per ton (g/t) in 2005 to less than 1.2 g/t in 2013.
Basically, the top five gold miners have to move a lot more ore to produce the same (or actually less) gold than they did just nine years ago.
One company that released their 2014 energy consumption figures was Newmont. Actually, Newmont’s total diesel consumption declined from 179 MG in 2013 to 158 MG in 2014. This was due to lower gold production as well as much lower volumes of waste rock. Newmont’s waste rock fell from 620 million tons in 2013 to 398 million tons in 2014. I would imagine part of the reason for the decline in waste rock was due to Newmont high-grading its mines. This is the mining technique of extracting the higher grade ore, resulting in higher gold yields with less waste rock removal.
I believe Barrick’s diesel consumption will also decline in 2014 as they cut back on the construction of many projects and also high-graded some of its gold mines. 2013 may turn out to be the year that the top five gold producers peaked in their total diesel consumption. Thus, peak of global gold production may be close at hand.
Please check back for new articles and updates at the SRSrocco Report. You can also follow us at Twitter below:


 “Interest rates are not going to significantly rise in the near term to any meaningful degree. In fact, it is very likely that interest rates on Government issued Treasuries will remain range bound between 1% and 4% for the next 20 years.”
Now, you can go back to what you were doing, OR you can read my reasoning as to why I believe this to be the case in the paragraphs below.
…..click HERE or the image to continue reading

 The Shanghai Composite falls almost 20% from its recent peak.
“This is probably not a dip to buy,” wrote analysts at Morgan Stanley. The bank lowered its price target for the Shanghai benchmark in a report Thursday, citing concerns like lofty valuations and high margin debt relative to China’s free float market capitalization. Margin debt, or the use of borrowed cash from brokerages, has reached 8.5% of the value of China’s tradable shares. That’s well above the 4.6% level Taiwan reached at the height of its market bubble.
…read more HERE
1. Your Big Picture Market Road Map …
by Larry Edelson
“Nearly every single market on the board is now setting up for a series of major tipping points….”
…..in this article Edelson gives you “a road map to help you see for yourself where the fireworks are likely to begin in each of the major markets”
 2. Richard Russell – Big Money Now Panicking As Legendary Economist John Williams Issues A Dire Warning
“Of everything I read there is one item that bothers me, it’s the newsletter by John Williams titled Shadow Government Statistics. But strangely, I never see him quoted.
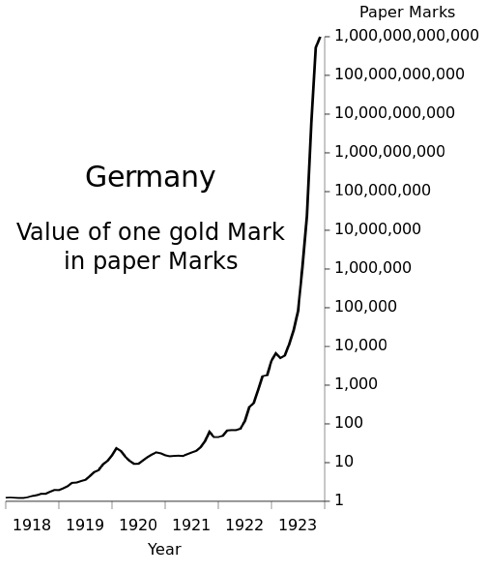
“the US dollar faces a massive decline, with implications for a meaningful upturn in inflation evolving into a great hyperinflationary crisis.
3. When Bonds Go Kaboom!
Its been 33 years when this bond market made its last turn with the yield on the 10-year Treasury bond at a high of almost 15% in 1982.
Yields have been trending downward ever since.
An investment in Walmart in 1982 roughly equals a return of $20,000 for every $100 invested.

USDCAD Overnight Range 1.2327-1.2395
FX volumes are down across the board in Europe as the weekend looms and another EU/Greece meeting is on the agenda. The US dollar has had a pretty good week. As of 7:00 am it has gained against the entire G-10 spectrum. The RBNZ contributed to the US dollar’s rise, claiming that NZD is at “unjustifiable and unsustainable levels”, which some interpret as “Bank-speak” for “FX intervention ahead”.
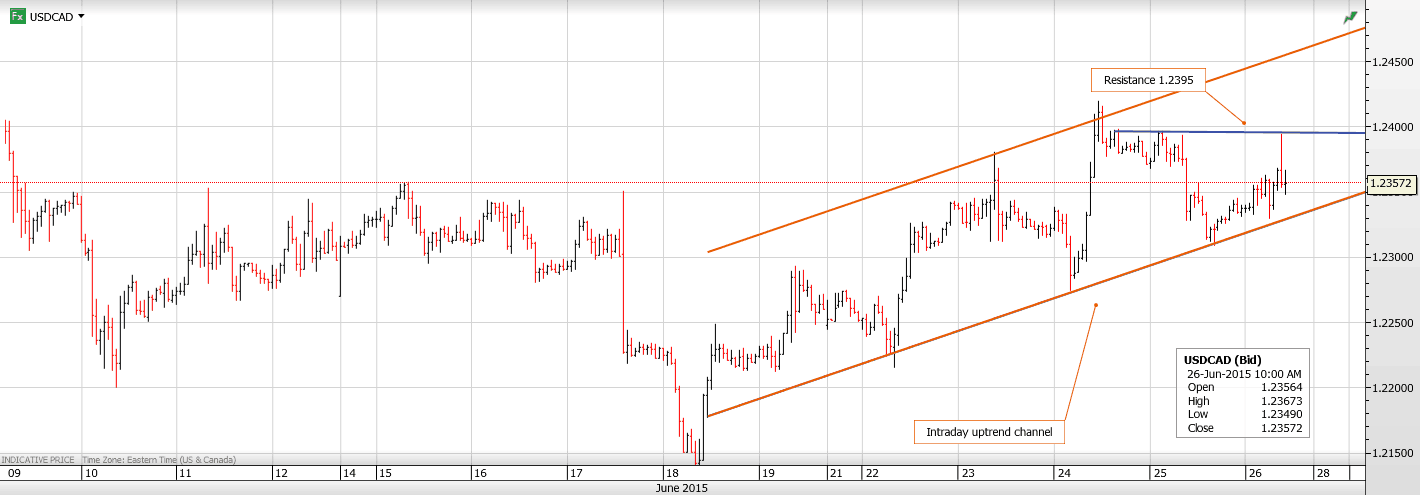
USDCAD started the day in New York with a modestly bid tone and managed to grind all the way to 1.2395 from 1.2355 before reversing and drifting back to its opening levels. Friday’s movement is merely a reflection of a “quote and cover” market rather than one with any direction.
It will be an eventful and volatile week coming up, with the bulk of the USDCAD action occurring on Tuesday. That is the day that Greece needs to pay the IMF. It is also the day Canadian GDP gets released and it is month end, quarter end and half-year end for portfolio managers.
USDCAD technical outlook
The intraday USDCAD technicals are bullish and in a modest uptrend channel since June 18. The bottom of the channel is currently 1.2325 and the top is at 1.2450. However there is “multi-top “resistance at 1.2390-00 which has capped short term rallies. A break above this resistance will extend gains to 1.2420 and then 1.2450. A break below 1.2325 may lead to a test of 1.2260. Meanwhile the 2 week range of 1.2155-1.2420 remains intact. For today, USD support is at 1.2325, 1.2305 and 1.2280. Resistance is at 1.2395 and 1.2420.
Today’s Range 1.2325-1.2395
Chart: USDCAD hourly with uptrend channel


-
I know Mike is a very solid investor and respect his opinions very much. So if he says pay attention to this or that - I will.
~ Dale G.
-
I've started managing my own investments so view Michael's site as a one-stop shop from which to get information and perspectives.
~ Dave E.
-
Michael offers easy reading, honest, common sense information that anyone can use in a practical manner.
~ der_al.
-
A sane voice in a scrambled investment world.
~ Ed R.
Inside Edge Pro Contributors

Greg Weldon

Josef Schachter

Tyler Bollhorn

Ryan Irvine

Paul Beattie

Martin Straith

Patrick Ceresna

Mark Leibovit

James Thorne

Victor Adair