
Timing & trends
I am issuing a “Red Flag Warning” To Financial Markets for the next six months of 2015. I have come to this conclusion that the next and most devastating financial collapse lies right in front of us. This information comes from my confidential sources who have shared this with me, and is supported by my 15+ years of trading and investment analysis experience, as well as the implementation of our financial forecasting models.
The SPX market internals/market breadth have started to correct itself and therefore the “rolling-over process” is now in progress. This is primarily due to the 7-year cycle. It has been slow, but steady. So far, the result has been to pressure prices into a short-term downtrend. This correction of the 7 year cycle will be significant! If we look at the first three trading days of 2015, the SPX was down 2.75%. The only other time in history that this occurred was when the SPX declined by more than 3% in the years 2000 and 2008.
Financial Markets do move in predictable waves, cycles and patterns. Economic cycles have enabled experienced analysts, as well as myself, to correctly forecast the timing of stock market peaks and stock market crashes/corrections over a very long period of time. These cycles are currently indicating that the U.S Financial Markets and the US Economy are about to enter a major downturn. These are repeating patterns that do occur in different fractals.
There are many cycles that I have studied over the last 15+ years. The 7-year cycle is most dominant and repetitive for our analysis and current application. We can look back at the most recent financial crisis which occurred in 2008 in which the stock market crashed, Lehman Brothers collapsed, and we were plunged into the worst recession that we had experienced since the Great Depression. Prior to that, the last time that the stock market experienced a major decline was during the bursting of the dot com bubble, seven years earlier. 2001 was a year of recession for the U.S. economy and of major problems for stocks. That was the year in which “9-11″ tragically occurred. Seven years earlier, in 1994, investors experienced the worst bond market of their lifetimes. Another seven years earlier brings us to 1987 in which most of us remember as “Black Monday”. These repeating patterns are well documented in history. The same price patterns appear, at any given time, from monthly, daily, hourly, even down to one minute charts. This is the reason why markets are “fractals”.

This current seven year cycle also aligns with the seven year “Shemitah cycle” that can be found in the Bible. The Sabbath year (shemita Hebrew: שמיטה, literally “release”) also called the sabbatical year or sheviit (Hebrew: שביעית, literally “seventh”) is the seventh year of the seven-year agricultural cycle mandated by the Torah for the Land of Israel and is still observed within contemporary Judaism. All of the great economic crashes in the U.S, including the Great Depression, have been in alignment with Shemitah years.

I first discovered a long term cycle when I came across “The Kondratieff Wave” while in my early years of studying finance and economics. It was developed by a Russian economist named Nikolai Kondratiev. Nikolai Kondratieff (Kondratiev), a Russian economist was the first to suggest that industrial economies followed a cycle of change within business cycles which included “inflation”, the “expansion of the economy” and “deflation”, which is the contraction of the economy within a “business cycle”.
During these periods of decline that occur, in the long waves, a large number of important discoveries and inventions in the technique of production and communication have been made. These are applied on a large scale at the beginning of the next long upswing.
The originally estimated cycle length lasts 50 to 54 years. These are shifts over time between economic growth “expansions” and periods of economic declines of “contractions”.
This is my interpretation of the time frame.
I have defined 6 long economic waves (cycles) and each of them was initiated by a specific technological revolution:
- (1600-1780) The wave of the Financial-agricultural revolution
- (1780-1880) The wave of the Industrial revolution
- (1880-1940) The wave of the Technical revolution
- (1940-1985) The wave of the Scientific-technical revolution
- (1985-2015) The wave of the Information and telecommunications revolution
- (2015-2035?)The hypothetical wave of the post-informational technological revolution
The only thing predictable about todays’ global economy is the “K Long-Wave” economic cycle. This is the reason more and more analysts are embracing the “K Long-Wave Principle” as an unrivaled economic indicator, and the source for accurate economic forecasts.
Our clients will profit substantially from the use of this proven advantage of the “K Long-Wave Principle” This wave is characterized by four seasons: Winter, spring, summer and autumn. We are currently in the Economic Winter. We are in a global depression and experiencing an economic collapse during this period of time which is identical to the “roaring twenties”, but now it is similar to 1929. The last “Great Depression” lasted fifteen years and a World War to get out of that economic downturn.
My technical trader which is also a Capitol Hill insider went into development and research for a 5 year period of time 30 years ago. What was created was a financial forecasting model, which he implemented 25 years ago. It is a Predictive Model in its nature. It forecasts nearly every major market turn, within the U.S Financial Market. It signaled that we exit all U.S Market positions on November 25th, 2014 for putting new investment money to work in US Equities.
Since that period of time, in history, the markets have just been “channeling” and going into a neutral position and we have been sitting in a “cash position” for these respective markets, which was the optimal position to be in. When it has confirmed that the “TOP”, is in place, we will implement the proper position in which we will substantially obtain huge gains. Until this time arrives, I ask that you follow our weekend updates.
Both, the 7 year cycle and “The Kondratieff Wave” are occurring at the same time. This is a major occurrence that will take place very shortly.
Derivatives are going to play a major role in this next upcoming major financial crisis. When you start hearing that word, on the news, then you will realize that things have started to really unravel. “Too big to fail” banks in the U.S have over 250 trillion dollars of total exposure to derivatives while only having 9.8 trillion dollars in total assets.
Derivatives are one of the three main categories of financial instruments. The other two are stocks (equities or shares) and debt (bonds and mortgages).
When, not “if”, the derivatives market crashes, all U.S citizens will be responsible for bailing out the major derivatives clearing houses. According to The Dodd-Frank Act: Section 2, U.S. taxpayers will bare the brunt. This gives the Federal Reserve the power to provide “discount and borrowing privileges” to derivatives clearing houses in the event of a major derivatives crisis.
Derivatives almost caused the complete collapse of the insurance giant AIG back in 2008. This financial crisis is inevitable because the causes of the previous one have not been solved. The derivative markets are not regulated, and they continue to grow unchecked. The truth of this matter, is that there are no financial resources left. It is now out of control, and we just allowed it to get bigger and bigger and bigger. The Federal Reserve, the US Congress and President Obama have created this situation, in which, there is not enough money in the world to cover these debts.
Chris Vermeulen
My technical trader which is also a Capitol Hill insider went into development and research for a 5 year period of time 30 years ago. What was created was a financial forecasting model, which he implemented 25 years ago. It is a Predictive Model in its nature. It forecasts nearly every major market turn, within the U.S Financial Market. This gives you (my) private clients the EDGE which does not exist anywhere else. It signaled that we exit all U.S Market positions on November 25th, 2014 for putting new investment money to work in US Equities.
Find out how to profit from the coming events here:http://www.thetechnicaltraders.com/GFWSS/

![]()
Excellent 5 4 3 2 1 No good
By voting every day you help us get you the charts you want to see.
![]()
“If you board the wrong train, it is no use running along the corridor in the other direction.” – Dietrich Bonhoeffer
Events of the Day
July 19, 2015 – British Open golf tournament begins (ends July 20th)
Stocks of the Day
— Find out which stocks investors are focused on with the most active stocks today.
— Which stocks are making big money? Find out with the biggest stock gainers today.
— What are the largest companies? Find out with the largest companies by market cap.
— Which stocks are the biggest dividend payers? Find out with the highest dividend paying stocks.
— You can also quickly review the performance, dividend yield and market capitalization for each of the Dow Jones Industrial Average Companies as well as the performance of the Dogs of the Dow.
Mailing List Info
Chart of the Day is FREE to anyone who subscribes.
To ensure email delivery of Chart of the Day, add mailinglist@chartoftheday.com to your whitelist.
Notes:
Where’s the Dow headed? The answer may surprise you. Find out right now with the exclusive & Barron’s recommended charts of Chart of the Day Plus.

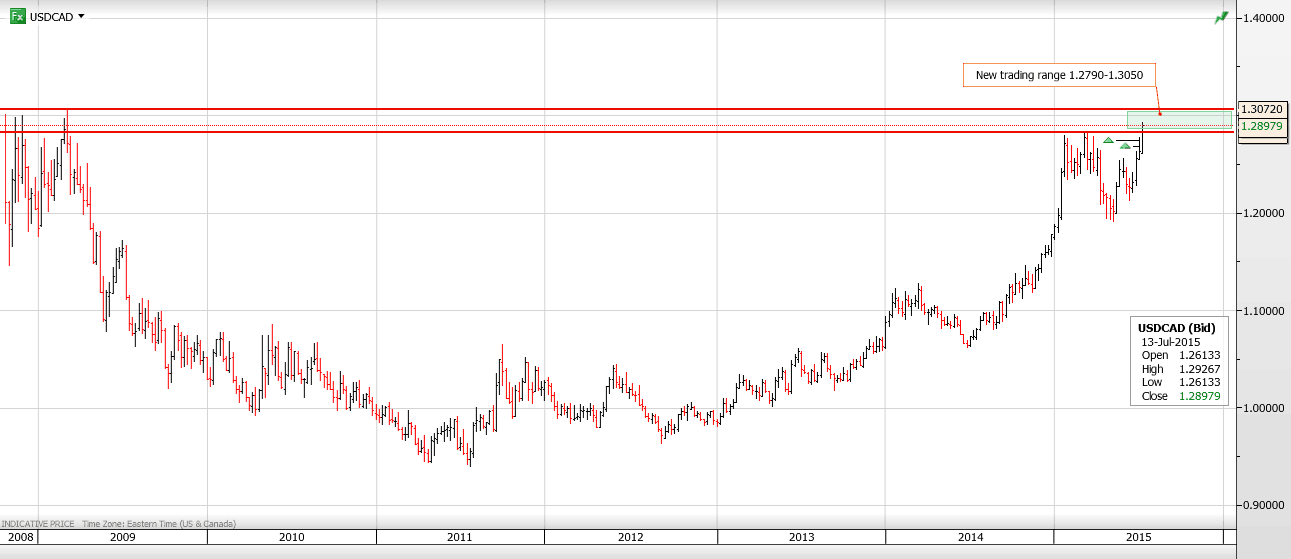
The Bank of Canada cut the overnight target rate to 0.5% and the Loonie lost over a cent in a second. There were many predictions of a rate cut although many lacked conviction which was probably why USDCAD reacted like the move was a surprise. The statement was very doveish as well, noting that “real GDP has likely contracted modestly in the first half”. This morning’s Manufacturing Sales data was also weak.
USDCAD is also being supported by the prospect of lower oil prices due to the Iran nuclear deal as well as the on-going slowdown in China. Janet Yellen’s testimony to Congress this morning revealed that the Fed is still on track to hike rates in 2015 providing support to the US dollar against the majors.
It was a fairly quiet overnight session. Slightly better than expected Chinese GDP data helped give AUDUSD a short lived boost until further China equity market declines erased any positive sentiment. The Bank of Japan left policy unchanged although the governor remarks were positive.
Going forward, assessment of Janet Yellen’s Congressional testimony and ongoing questions surrounding Greece and the Iran nuclear deal should keep the US dollar bid against the majors and USDCAD as well.
Technical Outlook
The intraday technicals are bullish while trading above the 1.2780-1.2820 level looking for a test of 1.3050, although 1.3000 may prove sticky, just because it is a “round number”. The steepness of today’s move has left a huge gap between 1.2790 and 1.2900 which will get back-filled.
Today’s Range 1.2840-1.2930
Chart: USDCAD Weekly with new trading range (green box)

 Few people see the train coming that wrecks their financial lives…
Another train wreck will occur. This is not pessimistic or cynical, just factual.
In the year 2000 the Tech-Wreck was unexpected…..
The housing market crash/financial crisis/train wreck of 2008 shocked most people…
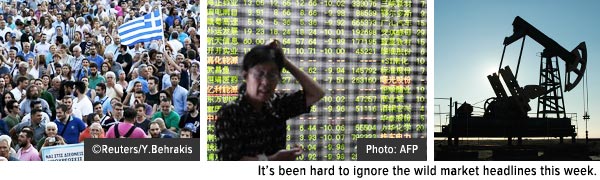
Reality set in for investors last week: Tremors are shaking up the global markets.
A “no” vote from the Greek referendum last Sunday, the vast stock market selloff in China, and the volatile movements in the price of U.S. crude oil have made it clear the worldwide economy is collectively riding the brakes. The 3.5-hour halt in trading on the NYSE also added to investors’ unease.
Last week on BNN TV, Canada’s leading business station, I explained that an important forward-looking economic indicator we closely monitor at U.S. Global Investors can help make sense of this slowdown: the global manufacturing purchasing managers’ index (PMI), which we’ve written about many times. Coupled with this, our portfolio managers recognize that during highly volatile markets adjusting cash levels in our funds is key.
In addition to our own macro models, BCA Research , a highly respected independent research company, pointed out that PMIs in developing economies have plunged to new lows. The International Monetary Fund also revised downward its global growth forecast for 2015. On this account, bad news is good news, as central bankers are scrambling to stimulate economic growth.

As active managers, we have raised our cash levels looking for opportunities in a sloppy market, particularly in our China Region Fund (USCOX). This allows us to mitigate risk and deploy that cash when stocks look attractive per our model, which focuses on factors like high
returns on invested capital, sales per share growth and dividend per share growth.
The Trend is Your Friend
It’s common for investors to look at gross domestic product (GDP) when making decisions about how to deploy capital. Unlike GDP, which looks back or in the rearview mirror, PMI is forward-looking. PMI gathers data such as global output, new orders, exports, prices and employment, making it a reliable indicator for both commodity performance and business activity. ISM, or Manufacturing Institute for Supply Management, is the U.S.-specific calculation of PMI.
Take a look at global PMI. It has continued on a three-month downtrend for the month of June.

Similarly, PMI in the U.S. peaked seven months ago but has since been modestly declining. The threat of rising rates has been a contributing factor, and although Federal Reserve Chairwoman Janet Yellen stated Friday that the U.S. is on track to raise rates in September, many agree that this date is too soon.

Card Counting: Using the PMI Pattern to Your Investing Advantage
Understanding PMI is one way investors can use patterns to improve their chances of positive returns in the market – just like card counting in a game of Blackjack.
When looking at PMIs, a reading of 50 or above indicates manufacturing expansion, while a reading below 50 indicates a slowing economy. PMIs for individual countries like China and Greece are negative right now, meaning that manufacturing activity is contracting.
Our investment team’s research has shown that when the one-month reading crossed below the three-month trend, there was a significant probability that materials, energy and commodities would fall six months later. Conversely, when it crossed above, manufacturing activity would ramp up, which greatly improved the performance of commodities such as copper and crude oil, along with the materials and energy sectors.
The Great Shift in Seasonal Oil
As I explain in our Managing Expectations whitepaper, using seasonal patterns, along with global PMI, is another way to understand trends in the market and the world at large.
Historically, the hurricane season in August/September has shut down the supply of oil offshore, leading to a peak in relative price around this time. But as you can see in the chart below, the new technology of fracking and a corresponding increase of U.S. onshore production, have led to a surplus, drastically shifting the shorter-term seasonal pattern in oil.

Staying Nimble During Changing Landscapes
Professor of Mathematics at the University of Oxford, Marcus du Sautoy, said it best:
“Although the world looks messy and chaotic, if you translate it into the world of numbers and shapes, patterns emerge and you start to understand why things are the way they are.”
The global markets right now indeed appear “messy and chaotic,” but curious investors and fund managers realize that specific tools and patterns help them navigate through the complexity and intensity of constantly changing landscapes.
In fact, it is the agile active management and the use of these investment tools that landed two of our funds in Investor’s Business Daily’s “Weekly Review” section last week. This particular section of IBD is a screened list of top-rated stocks for the week, along with the top-performing funds that own these particular stocks. Our Holmes Macro Trends Fund (MEGAX) and Global Resources Fund (PSPFX) are recognized for owning nine of these top stocks.
Subscribing to our award-winning Investor Alert newsletter is one way investors can stay on top of geopolitical and economic events that could affect their investments. We’d really appreciate it if you’d share our publication with your friends and colleagues!
Please consider carefully a fund’s investment objectives, risks, charges and expenses. For this and other important information, obtain a fund prospectus by visiting www.usfunds.com or by calling 1-800-US-FUNDS (1-800-873-8637). Read it carefully before investing. Distributed by U.S. Global Brokerage, Inc.
Past performance does not guarantee future results.
Foreign and emerging market investing involves special risks such as currency fluctuation and less public disclosure, as well as economic and political risk. By investing in a specific geographic region, a regional fund’s returns and share price may be more volatile than those of a less concentrated portfolio. Because the Global Resources Fund concentrates its investments in specific industries, the fund may be subject to greater risks and fluctuations than a portfolio representing a broader range of industries. Stock markets can be volatile and share prices can fluctuate in response to sector-related and other risks as described in the fund prospectus.
The Purchasing Manager’s Index is an indicator of the economic health of the manufacturing sector. The PMI index is based on five major indicators: new orders, inventory levels, production, supplier deliveries and the employment environment.
The S&P 500 Energy Index is a capitalization-weighted index that tracks the companies in the energy sector as a subset of the S&P 500. The S&P 500 Materials Index is a capitalization-weighted index that tracks the companies in the material sector as a subset of the S&P 500.
All opinions expressed and data provided are subject to change without notice. Some of these opinions may not be appropriate to every investor. By clicking the link(s) above, you will be directed to a third-party website(s). U.S. Global Investors does not endorse all information supplied by this/these website(s) and is not responsible for its/their content.


-
I know Mike is a very solid investor and respect his opinions very much. So if he says pay attention to this or that - I will.
~ Dale G.
-
I've started managing my own investments so view Michael's site as a one-stop shop from which to get information and perspectives.
~ Dave E.
-
Michael offers easy reading, honest, common sense information that anyone can use in a practical manner.
~ der_al.
-
A sane voice in a scrambled investment world.
~ Ed R.
Inside Edge Pro Contributors

Greg Weldon

Josef Schachter

Tyler Bollhorn

Ryan Irvine

Paul Beattie

Martin Straith

Patrick Ceresna

Mark Leibovit

James Thorne

Victor Adair