Posted July 12, 2015

Forex Trading Alert originally sent to subscribers on July 16, 2015, 7:28 AM.
The situation in EUR/USD has deteriorated after Greece’s parliament passed harsh austerity measures demanded by the country’s creditors in order to secure a third bailout package. As a result, the pair dropped to levels not seen since May. Time for double bottom or further declines?
In our opinion the following forex trading positions are justified – summary:

The first thing that catches the on the above chart is a breakdown below the lower border of the blue consolidation, which is a bearish signal that suggests further deterioration.
What impact did this drop have on the very short-term picture? Let’s check.
From this perspective, we see that EUR/USD broke below the orange zone based on the previous lows. In this way, the exchange rate invalidated a potential reverse head and shoulders formation, which Is a bearish signal that suggests further deterioration (especially when we factor in the current position of the indicators). How low could the exchange rate go in the coming days? In our opinion, the initial downside target for currency bears would be around 1.0818-1.0845, where the May low and the 61.8% Fibonacci retracement are. If this area is broken, e may see a decline to the medium-term green support line (currently around 1.0703) or even to 1.0676-1.0698, where the green support zone (created by the 76.4% and 78.6% Fibonacci retracement levels) is.
Very short-term outlook: bearish
Short-term outlook: mixed with bearish bias
MT outlook: mixed
LT outlook: mixed
Trading position (short-term; our opinion): Short positions (with a stop-loss order at 1.1058) are justified from the risk/reward perspective at the moment. We will keep you informed should anything change, or should we see a confirmation/invalidation of the above.


Looking at the daily chart we see that the most important improvement of recent days is a successful breakout above the long-term red line and the orange resistance zone. With the last upswing USD/CHF broke also above the May high, which means that the way to the 50% Fibonacci retracement is open. If it is broken, the next target would be around 0.9627 (the 100% Fibonacci price projection marked with blue on the weekly chart) or even the upper border of the rising trend channel (currently around 0.9648).
Very short-term outlook: bullish
Short-term outlook: mixed with bullish bias
MT outlook: mixed
LT outlook: mixed
Trading position (short-term; our opinion): No positions are justified from the risk/reward perspective at the moment. We will keep you informed should anything change, or should we see a confirmation/invalidation of the above.
In our last commentary on this currency pair, we wrote the following:
(…) the pair remains under the red declining resistance line (the lower border of the declining trend channel), which suggests that as long as there is no invalidation of the breakdown another pullback is likely. If this is the case, and the pair moves lower from here, it would be a bearish signal, which will likely result in a test of the recent low or even trigger a decline to the 127.2% extension in the coming day(s).
As you see on the daily chart, the situation developed in line with the above scenario and AUD/USD reached our downside target yesterday. Although this support level triggered a small rebound earlier today, we maintain our assumption that as long as there is no invalidation of the breakdown below the red declining resistance line another pullback is likely. How low could the pair go? If today’s low is broken, the next target would be around 0.7320 where the brown support line is. However if currency bears manage to push the exchange rate lower, we may see a decline even to (around 0.7097-0.7200, where the green support zone based on the 76.4% and 78.6% Fibonacci retracement levels (marked on the weekly chart) is.
Very short-term outlook: mixed with bearish bias
Short-term outlook: mixed
MT outlook: mixed
LT outlook: mixed
Trading position (short-term; our opinion): No positions are justified from the risk/reward perspective at the moment. We will keep you informed should anything change, or should we see a confirmation/invalidation of the above.
Thank you.
Nadia Simmons
Forex & Oil Trading Strategist
Przemyslaw Radomski, CFA
Founder, Editor-in-chief

Posted July 12, 2015
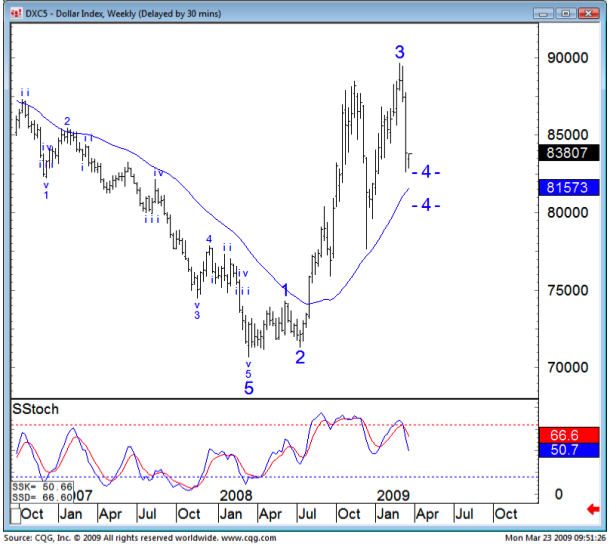
On Tuesday the silver market made its lowest close since 2009. The COT data shows a net short position of 14,319 commercials and net long position of 6,793 non-commercials (speculators) in the futures market. These are levels not seen last November. Many interim lows in silver have occurred with the speculative longs between 1,000 and 8,000 AND Commercial shorts between 10,000 and 25,000 as experienced this week.
However, the major bear markets of 1986, ’92, ’97 and ’01 ended with a more negative bias. The non-commercials positions were a net negative and commercials held fewer than 8,000 net shorts.

Aside from the absolute level of the COT positions we are interested in the rate that the positons change. Typically, the end of a price trend will result in a spike in the positions. This results in RSI(14) readings moving out of the 65/35 range. It also pushes them outside the Bollinger Bands. Both measures came close to minor buy signals this week.
The COT data in gold has reached outright levels last seen eighteen months ago. Those preceded the low at $1186 by two weeks and subsequent rally to $1392 in March 2014. However, every bear market (price below a declining 100-week average) has bottomed after the commercials were net-long and non-commercials net short for an extended number of months*.
So the bottom line is that if prices reverse to the upside from here we can anticipate a tradable seasonal bounce, but not likely the beginning of a bull market. However, a more severe decline in the next few weeks would set up much stronger buy signals.
*Available data from the CFTC only dates back to 1986.

The opinions in this report are solely those of the author. The information herein was obtained from various sources; however we do not guarantee its accuracy or completeness. This research report is prepared for general circulation and is circulated for general information only. It does not have regard to the specific investment objectives, financial situation and the particular needs regarding the appropriateness of investing in any securities or investment strategies discussed or recommended in this report and should understand that statements regarding future prospects may not be realized.
Investors should note that income from such securities, if any, may fluctuate and that each security’s price or value may rise or fall. Accordingly, investors may receive back less than originally invested. Past performance is not necessarily a guide to future performance. Neither the information nor any opinion expressed constitutes an offer to buy or sell any securities or futures contracts. Foreign currency rates of exchange may adversely affect the value, price or income of any security or related investment mentioned in this report. In addition, investors in securities such as ADRs, whose values are influenced by the currency of the underlying security, effectively assume currency risk. Moreover, from time to time, members of the Institutional Advisors team may be long or short positions discussed in our publications.
The above are the Technical observations of Ross Clark for Institutional Advisors
on Friday, 17 July 2015 02:00
Posted July 12, 2015
BOB HOYE, INSTITUTIONAL ADVISORS
EMAIL bobhoye@institutionaladvisors.com
WEBSITE www.institutionaladvisors.com

Last month in our Vice Index update, we noted the following:
The Vice Index points to continued consumer strength through 3Q.
The Vice Index is doubling down on consumer strength. While it shows a slight dip year-over-year for June, that’s because last year’s June was a strong base. The trend remains for strong, steady spending.

For 114 straight trading days, starting on February 3, the S&P 500 has closed every session between 2,040.24 and 2,130.82. That’s one of the tightest trading ranges ever for a period of that length—a trading band of just 4.44%.

The “buy every dip” rally that characterized last year’s market has gone away. Here’s a fascinating stat: The market has had more down days this year to date than in any year since 2002, but the drops are getting smaller. The average loss this year has been just 0.57%, compared with 0.80% since 2009. Despite the market’s lack of direction, we’ve seen a lot of drama this summer with the popping of China’s bubble and the ongoing mess in Greece. I promise you that this will be a Greece-free issue.
….continue reading including more market analysis and seven of CWS’s Buy List stocks HERE

 Yesterday, dealers spent most of the day waiting for the Greek vote and then, later in the day, Janet Yellen’s semi-annual HH (Humphrey Hawkins) testimony in front of the House Financial Services Committee. The Greek vote was rather well publicized throughout the day and confirmation that the measures would be accepted should be no huge surprise. With around 30% of Mr. Tsipras’s own party failing to back the vote, after a day of emotional debate, we should expect to see a reshuffle very soon. 2yr GGB (Greek Govt. Bond) last saw 26.5%.
The euro did trade well in early session, but by early afternoon trading the sellers were in and once through 1.1000 it never really looked back. Janet Yellen’s speech did nothing to halt the euro’s slide as she reiterated that the Fed remains on track to raise rates this year, with the one caveat being, “as long as the economy evolves as expected” the pressure increased upon the euro.
The U.S. Treasury market did not see the kind of aggressive sell-off one might expect after such rate comments, but we did see some weakness across the curve. All the way along the yield curve from 2’s (2yr notes) out to 30’s yields were 2-4bp higher after a day where we had seen some positive gains in bonds. The US$ is still seen as the safe-haven bid, which is one explanation why both bonds and stocks held-in!
Gold suffered from mid-day London, trading down over $8 at one stage to 1143. Rate talks are leaning on the precious metal at the moment, and given its recent performance, does not look to have many friends to talk it up just yet.
China saw a solid 7% growth (just out) and is reflected in most Asian Stock Exchanges. Nothing really to write home about but a positive day all around at present.
…related:


I know Mike is a very solid investor and respect his opinions very much. So if he says pay attention to this or that - I will.
~ Dale G.
I've started managing my own investments so view Michael's site as a one-stop shop from which to get information and perspectives.
~ Dave E.
Michael offers easy reading, honest, common sense information that anyone can use in a practical manner.
~ der_al.
A sane voice in a scrambled investment world.
~ Ed R.

Greg Weldon

Josef Schachter

Tyler Bollhorn

Ryan Irvine

Paul Beattie

Martin Straith

Patrick Ceresna

Mark Leibovit

James Thorne

Victor Adair