
Bonds & Interest Rates
 It is a slow day in a little Greek Village . The rain is beating down and the streets are deserted. Times are tough, everybody is in debt, and everybody lives on credit.
On this particular day a rich German tourist is driving through the village, stops at the local hotel and lays a €100 note on the desk, telling the hotel owner he wants to inspect the rooms upstairs in order to pick one to spend the night.
The owner gives him some keys and, as soon as the visitor has walked upstairs, the hotelier grabs the €100 note and runs next door to pay his debt to the butcher.
The butcher takes the €100 note and runs down the street to repay his debt to the pig farmer.
The pig farmer takes the €100 note and heads off to pay his bill at the supplier of feed and fuel.
The guy at the Farmers’ Co-op takes the €100 note and runs to pay his drinks bill at the taverna.
The publican slips the money along to the local prostitute drinking at the bar, who has also been facing hard times and has had to offer him “services” on credit.
The hooker then rushes to the hotel and pays off her room bill to the hotel owner with the €100 note.
The hotel proprietor then places the €100 note back on the counter so the rich traveller will not suspect anything.
At that moment the traveller comes down the stairs, picks up the €100 note, states that the rooms are not satisfactory, pockets the money, and leaves town.
No one produced anything. No one earned anything. However, the whole village is now out of debt and looking to the future with a lot more optimism.
And that is how the bailout package works.
From Money Talks reader Joe Grant Kelly joegrantkelly@gmail.com

 As people continue to digest breaking news out of Greece and around the world, the Godfather of newsletter writers, 90-year-old Richard Russell, warned that panic will set in if we get confirmation that economist John William’s dire prediction is now unfolding.
….continue reading about John Williams prediction and RR’s opinion HERE

The low-yield environment manufactured by central banks has encouraged and precipitated yield-seeking speculation. Investors and speculators alike have taken up a near-religious conviction in the demi-god status of central bankers. Will these central bankers continue to enjoy their god like status indefinitely or will they disappoint their followers?
In one of our earlier articles, US Equities: Overvalued or Undervalued, we surveyed the historical experience of valuation tools. In that article, we observed that the U.S. equity markets are priced for very low subsequent investment returns. This article adds to the historical experience by providing an overview of the potential risk that investors face, should we enter a bear market.
A market on steroids
Since the depth of the March 2009 bottom, the U.S. stock markets have more than trebled, having risen by about 215%[2] over a period of 75 months. Figure 1 shows the 75-month rate of change for the S&P500 Index for the last 140 years. The reason for using a 75-month rate of change is that the length of market’s current move from its trough is 75 months. Clearly, the current rate of change is in extreme territory and is exceeded only by three other market up-moves: the roaring bull market of twenties leading into the Great Depression, the bull market of the fifties and the technology boom. Further, the trajectory of the up-move is similar to that of the market leading into the highs of 1929 and the highs in 1938[3].
We have had a market on potent steroids.
Figure 1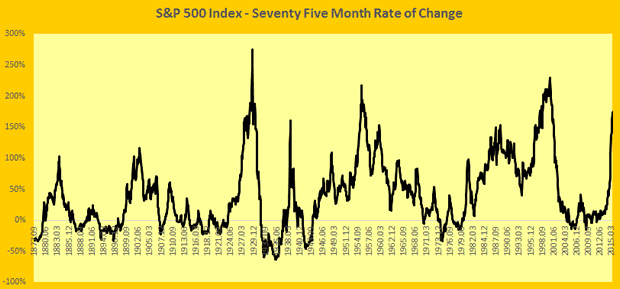
Sub-par economic growth
Interestingly, this strong performance of the U.S. equity markets has taken place while the broader economy hasn’t really done all that well. Economic growth rates have been sub-par for much of this equity market rally. Table 1 shows the average real GDP growth rates experienced during the three market up moves discussed earlier where the rate of change exceeded that of the current market. For comparison,we have provided the GDP growth rates experienced thus far during this up move.
Table 1[4] 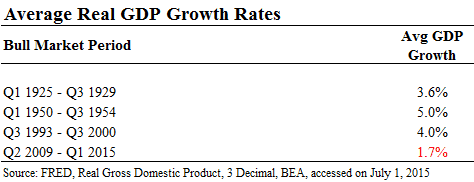
A bull market or a new market?
Naturally, this has prompted many astute market participants to raise questions about the sustainability of current price levels. John Hussman, Jeremy Grantham and others have pointed out the significant overvaluation of U.S. equities. On the other hand, many find the markets to be fairly valued based on a different set of valuation tools. The key point of contention between these two groups is the selection and application of valuation tools. However, there is a much more basic issue that investors have to contend with. As Benjamin Graham so eloquently put it, “The main issue before the investor may be expressed this way: Have we been in a bull market or in a new sort of market?[5]“
If we are in a bull market, we will indeed have a bear market following it. It is much like how night is inevitable after day. However, if you believe that we are in a new market where central bankers’ superpower is sufficient to fend off any bearish inclinations without regard to valuations, then the valuation question is irrelevant. In such a case, the inevitability of the bear market doesn’t hold.
Assuming we are in a bull market, it will pay to understand the kind of declines we could experience if we were to enter a bear market. Table 2[6] shows the declines experienced during the last 20 bear markets over the past 140 years[7]. The right-most column applies these declines to the recent S&P500 high of 2,100.
Table 2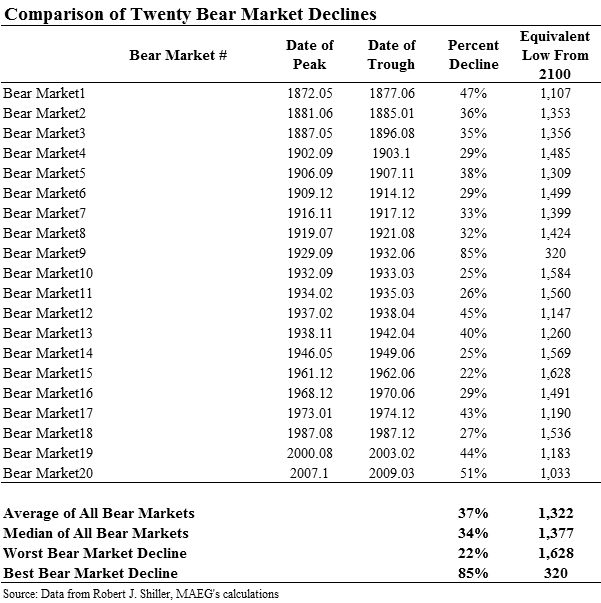
As shown in Table 2, a decline that is equivalent to the average of all 20 bear markets will indicate a market low of about 1,300 in the S&P 500, a fall of nearly 40%. None of this analysis means that a decline of this extent, or any decline at all, is imminent. However, an investor will do well to prepare herself mentally for such a decline and understand that a ≈40% decline in a bear market is a rather normal event.
That is not all that we can learn from past experience. As we would have expected, there is a significant relationship between valuation levels at the beginning of a bear market and the subsequent decline experienced. Table 3 shows the level of cyclically adjusted price to earnings (CAPE) ratio at the beginning and end of each one of the past 20 bear markets except for the first one[8].
Table 3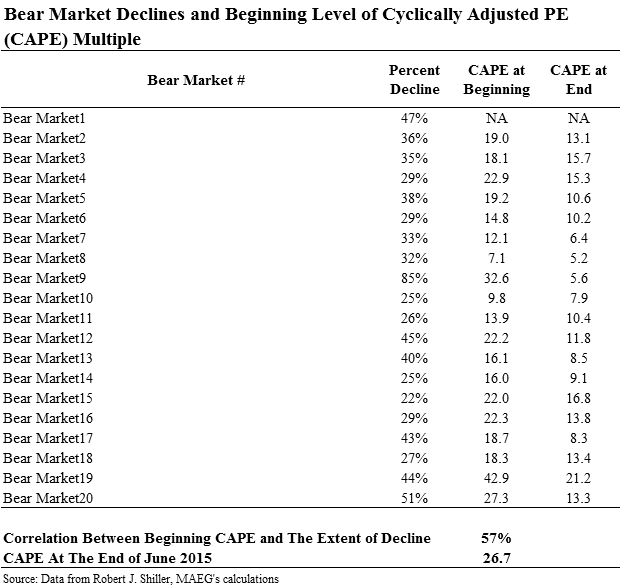
The correlation between beginning CAPE levels and the subsequent declines experienced is 57%. What this means is that the higher the CAPE at beginning, the larger the subsequent decline. The CAPE multiple at the end of June 2015 was nearly 27, higher than 17 of the past 20 bear markets.
Investors will be well served to keep in mind and mentally prepare for what historical experience has taught us regarding market fluctuations during a bear market. We don’t recommending jumping ship. But ensure that you have your life jackets and safety boats ready and at your disposal.
[1] This article is inspired by the talk delivered by Benjamin Graham at University of California, Los Angeles, on December 7, 1959. You can find an article based on Benjamin Graham’s talk here.
[2] As evidenced by S&P 500’s move from the lows in March 2009 to recent highs in June of 2015.
[3] Do not be fooled by the Rate of Change (RoC) chart in Figure 1. Just because the RoC peaked doesn’t mean that the markets had a decline immediately afterward. All it means is that the rate of advance slowed.
[4] Data for 925 – 1929 is taken from following link: http://www.usstuckonstupid.com/sos_downchart.php?year=1920_1939&units=s&chart=gdp&bar=1&stack=1&size=m&title=&color=c#sos302
[5] Talk delivered by Benjamin Graham at University of California, Los Angeles, on December 7, 1959.
[6] The calculations in this table are based on monthly closing price data. As the intra-month highs and lows are likely to have been higher and lower respectively when compared to the month end numbers, this table likely understates the extent of full declines experienced.
[7] Nerdy Details: For the purposes of this analysis, we have defined a bear market as any period during which the peak to bottom decline equaled or exceeded 20% on a monthly closing basis. Further, we have defined a bull market which resulted in an upward move of 25% or more from the lows on a monthly closing basis.
[8] The CAPE data is available from 1881 onwards. As the Bear Market #1 took place before 1881, the CAPE data is not available for this bear market move.

1. We Just Arrived in Athens… Here’s What We Saw…
2. Debt is the Barbarous Relic. Not Gold
“Owning gold is saving, which by definition is civilized, i.e. NOT barbarous.
Debt, on the other hand, is the exact opposite. It is a lack of savings that shows a complete disregard for the future.”
….read more HERE
3. No Amount of Money Printing Will Spark Inflation …
by Larry Edelson
‘Combined, the world’s major central banks have printed some $10 trillion of new money since 2008. Yet …”
Fact #1: There’s no inflation in sight.
Fact #2: There’s no wage inflation.
Fact #3: There’s no commodity inflation
Fact #4: The supposed leading indicator for inflation, gold, is in a bear market.
Fact #5: All that money printing and the Dollar has soared!
….read more HERE
The S&P 500 Index has hit numerous new highs in the past three years. Note the log-scale graph below and the broken support lines from 2000 and 2007. The current support line, depending on where it is drawn, is on the verge of breaking.
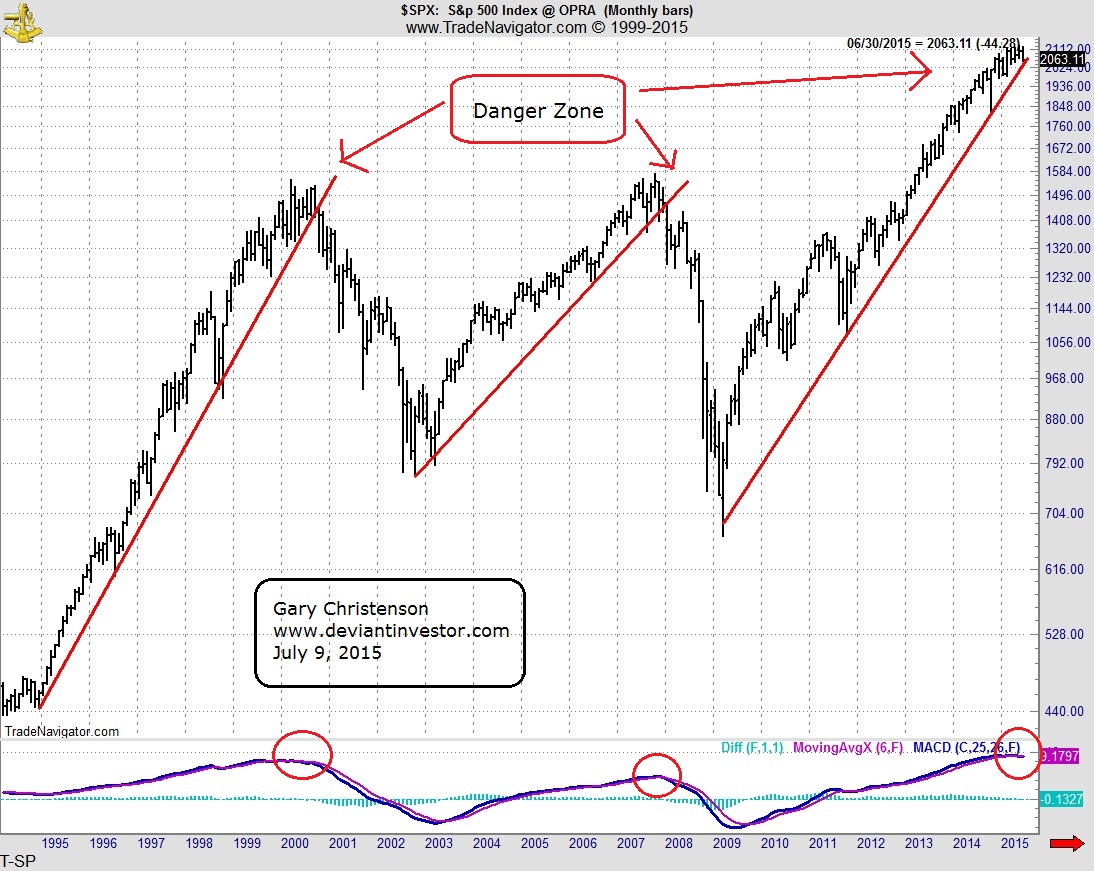
Further, Paul Mylcheerst says the modified monthly MACD has given a sell signal on the S&P. The same indicator gave sell signals close to the peaks in 2000 and 2007.
There is significant risk in the S&P 500 Index in spite of the fact that central banks and governments have successfully levitated the stock and bond markets.
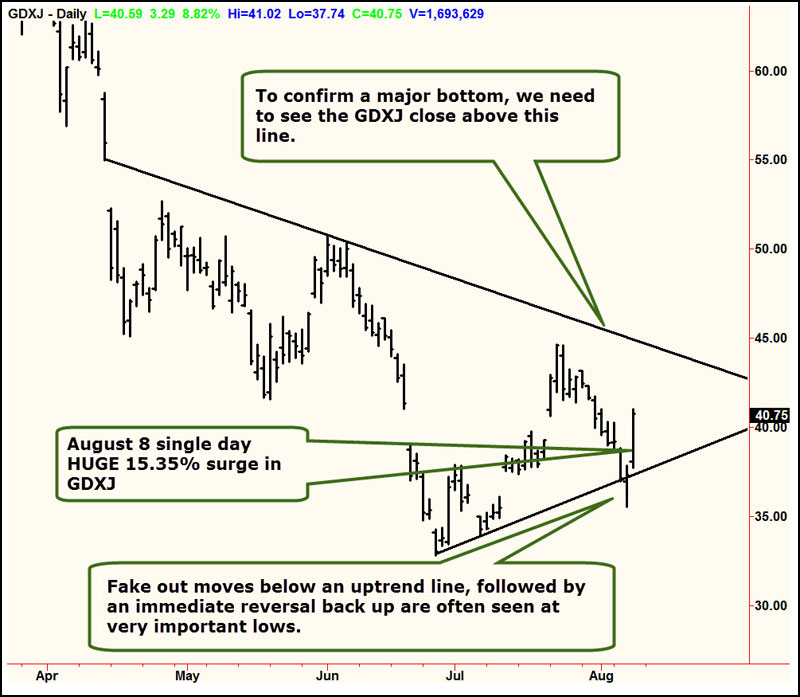
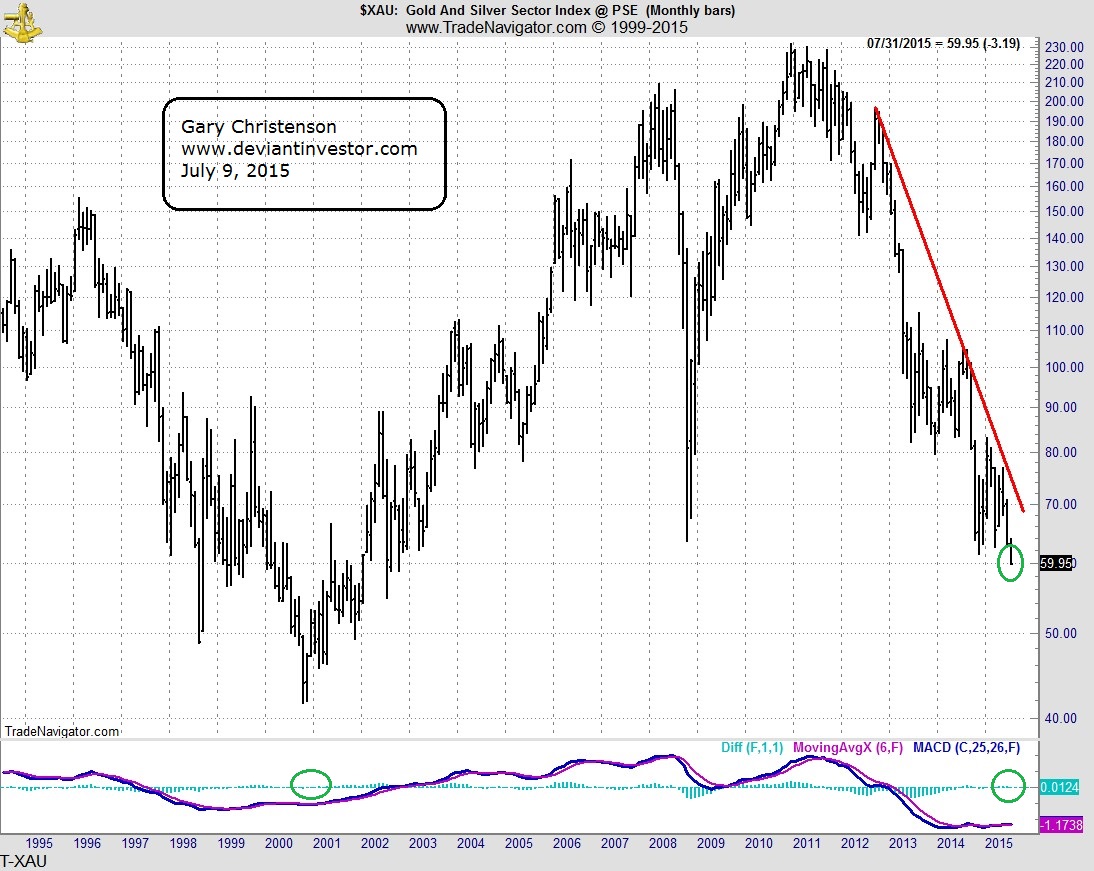
By contrast, the XAU, an index of gold stocks, has fallen to a 13 year low, and the monthly MACD indicator that gave the sell signal on the S&P has tentatively indicated a buy signal on the XAU.
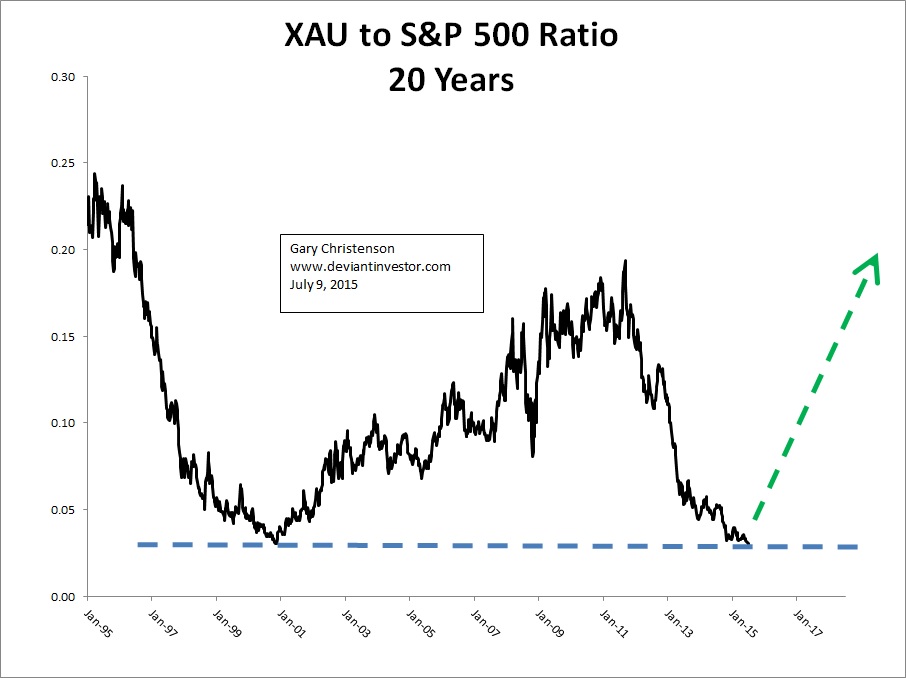
What about the ratios?
Consider the ratio of the XAU to the S&P 500 Index. The ratio is at the low end of the 20 year range and at a 14 year low because the XAU stocks have been crushed and the S&P has been levitated.
The S&P up and XAU down trends appear ready to reverse. The charts show extremes in prices and in the ratio.
The low risk trade is to sell S&P related stocks and to buy gold, silver, and gold and silver stocks. Sell high and buy low!
CONCLUSIONS:
- The S&P 500 Index hit an all-time high in May 2015.
- The XAU index of gold stocks hit a 13 year low this month – July.
- The XAU to S&P ratio shows that gold stocks have been weak for several years and appear ready to reverse higher.
- Gold prices have been crushed since August 2011 while paper bonds and stocks have been “strongly encouraged” by global central banks.
- The MACD (modified by Paul Mylcheerst) has given a monthly sell signal on the S&P 500 Index (don’t discount this), a buy signal on the XAU, and is close to a monthly buy signal on gold.
-
Take the low risk road. At this time the S&P looks like a high risk path while gold, silver and the XAU look like a low risk road.
Gary Christenson
The Deviant Investor


-
I know Mike is a very solid investor and respect his opinions very much. So if he says pay attention to this or that - I will.
~ Dale G.
-
I've started managing my own investments so view Michael's site as a one-stop shop from which to get information and perspectives.
~ Dave E.
-
Michael offers easy reading, honest, common sense information that anyone can use in a practical manner.
~ der_al.
-
A sane voice in a scrambled investment world.
~ Ed R.
Inside Edge Pro Contributors

Greg Weldon

Josef Schachter

Tyler Bollhorn

Ryan Irvine

Paul Beattie

Martin Straith

Patrick Ceresna

Mark Leibovit

James Thorne

Victor Adair