
Gold & Precious Metals

Available Mon- Friday after 6:00 P.M. Eastern, 3:00 Pacific.
DOW + 14 on 1,100 net declines
NASDAQ COMP + 9 on 1,050 net declines
SHORT TERM TREND Bullish
INTERMEDIATE TERM TREND Bullish
STOCKS: The averages were higher on Monday. Better than expected earnings reports and a receding crisis with Greece got the credit.
But, for the second session in a row, the markets rallied on poor internals. This normally is not a good sign, especially when you consider that the S&P 500 is at a resistance zone. See the chart below.
GOLD: Gold was clobbered for $35. Rumors about Chinese bank selling. Greenback up again.
NEXT DAY: Tuesday. No prediction
CHART: The S&P 500 is fast approaching the peak of mid may, but the advance decline line is nowhere close (arrows). Also, the last two days have been atrocious. This doesn’t guarantee a decline, especially since earnings have been pretty good, but it makes us want to take profits on our trading profits.

BOTTOM LINE: (Trading)
Our intermediate term system is on a buy. We are long the SPY from 206.42. If there are more declines than advances at 3:45 EST, sell at the close.
System 7 We sold the SSO at 68.66 for a gain of 2.96. Stay in cash on Tuesday.
System 8 We are in cash. Stay there.
GOLD We are in cash. Stay there.
News and fundamentals: There were no important economic releases on Monday and there will be none on Tuesday.
Interesting Stuff Gold and silver keep getting clobbered. Gold has been declining for 4 years. Silver even more. But, we still see TV advertisements urging people to buy gold and silver. When these ads stop, perhaps we’ll get a bottom.
TORONTO EXCHAN GE: Toronto got clobbered for 217 points.
S&P/TSX VENTURE COMP: The TSX dropped 12.
BONDS: Bonds fell back slightly.
THE REST: The dollar keeps moving higher. Silver and crude oil were whacked pretty hard.
We’re on a buy for bonds as of June 11.
We’re on a buy for the dollar and a sell for the euro as of July 16.
We’re on a sell for gold as of July 2.
We’re on a sell for silver as of June 23.
We’re on a sell for crude oil as of July 16.
We’re on a sell for the Toronto Stock Exchange as of May 6.
We’re on a sell for the S&P\TSX Venture Fund as of October 30, 2014.
We are on a long term buy signal for the markets of the U.S., Canada, Britain, Germany and France.
|
Fri. |
Mon. |
Tue. |
Wed. |
Thu. |
Fri. |
Mon. |
Evaluation |
|
|
5 day RSI S&P 500 |
54 |
66 |
70 |
69 |
76 |
77 |
85 |
– |
|
5 day RSI NASDAQ |
58 |
68 |
72 |
70 |
79 |
84 |
78 |
– |
|
McCl- lAN OSC. |
+41 |
+110 |
+140 |
+95 |
+148 |
+82 |
+20 |
0 |
|
Composite Gauge |
7 |
3 |
7 |
10 |
6 |
11 |
12 |
0 |
|
Comp. Gauge, 5 day m.a. |
11.6 |
9.6 |
9.4 |
8.0 |
6.6 |
7.4 |
9.2 |
0 |
|
CBOE Put Call Ratio |
1.00 |
.57 |
.97 |
.96 |
.88 |
.84 |
.91 |
0 |
|
VIX |
16.83 |
13.90 |
13.37 |
13.23 |
12.11 |
11.95 |
12.25 |
– |
|
VIX % change |
-16 |
-17 |
– 4 |
-1 |
– 8 |
-1 |
+3 |
0 |
|
VIX % change 5 day m.a. |
-2.8 |
– 6.4 |
-6.2 |
-7.2 |
-9.2 |
-6.2 |
-2.2 |
0 |
|
Adv – Dec 3 day m.a. |
+113 |
+1233 |
+1322 |
+547 |
+476 |
-116 |
-275 |
0 |
|
Supply Demand 5 day m.a. |
.48 |
.57 |
.54 |
.61 |
.80 |
.78 |
.69 |
0 |
|
Trading Index (TRIN) |
.88 |
.60 |
.73 |
1.28 |
1.23 |
1.32 |
1.12 |
0 |
|
S&P 500 |
2077 |
2100 |
2109 |
2107 |
2124 |
2127 |
2128 |
Plurality -3
|

We are believed to be on the verge of another deflationary downwave, similar to or more severe than the one which drove the dollar spike – and commodity slump – between July of last year and March, and caused by an intensification of the debt crisis, with increasing capital flight out of Europe and into dollar assets as the EU crumbles. More QE will not save the situation, as it is already discredited and will have no more effect than trying to inflate a tire or rubber boat that has a big hole in it.
It is understood that in this modern age many readers have a very limited attention span, due to time constraints and the tendency to multi-task. For this reason this update is being kept short and to the point. It is intended to make plain in the clearest possible manner the scenario that is expected to unfold in the coming months. So let’s get to it.
The only way to purge debt is to retrench – curb spending and balance the books. Modern governments have sought to avoid this responsibility for years now, by cheating and printing money out of nothing, because they are not subject to the discipline of a gold standard. The result of this is a towering debt and derivatives mountain that is set to bury them, despite their meddling in the markets to keep interest rates at zero to stop the debt compounding. Debt to GDP levels have risen to unsustainable levels in many countries around the world. This is why economies are weakening and standards of living are dropping, and the problem has now caught up with China. We are now caught in a downward deflationary spiral and it won’t stop until the debt is purged or written off. The astronomic magnitude of the debt means that the situation could quickly get out of control leading to a global economic calamity. Few investments will be spared as the liquidation intensifies, and the dollar will be the prime beneficiary of this especially as a torrent of funds will flee Europe as it backslides into chaos.
That’s enough of an introduction, now let’s look at the charts starting with the dollar.
The dollar index chart looks very positive, with it now breaking out upside from a Triangular consolidation that allowed its earlier heavily overbought condition to unwind. Note the strongly bullish alignment of its moving averages. It is now in position to take off and this upleg is likely to be as big as the one that ran from last July to March – or bigger – meaning that it could advance towards 120.

Of course, a big reason for the dollar’s strength is the malaise of the dying euro (the dollar index is made up 57% of the euro), with the bungling incompetent actions of the EU’s leaders in respect to Greece making plain to the world that they are unfit for office, and that the European Union will probably eventually unravel. Having seen what was done to Greece, we can be in no doubt that the leaders of Italy, Portugal, Spain will be considering their options. The euro look set to drop hard as shown on its 2-year chart below.

Of course a strongly rising dollar will wreak havoc on commodity prices, as it did when it rose strongly the last time, from July of last year through March. The commodity index shown below should plunge as shown by the red arrow.

Copper appears to have been marking out a massive top pattern on its long-term charts, and it looks set to plunge to strong support at its 2008 crash lows in the $1.25 area, and perhaps lower. Its COTs are currently quite bullish, so we may see a relief rally at some point. However, its key support has already failed some time ago and it is now very vulnerable.

The oil chart has some similarities with copper, which is because they are both dropping due to deflation. Oil looks set to be particularly hard hit and may drop into the mid-$20’s.

Gold, which has been struggling to find a footing for 2 years now, is expected to be forced into another downleg by another strong dollar upleg, and should drop to the $850 – $100 area, probably nearer to $850.

Silver will crash support and drop towards the lower boundary of its long-term downtrend channel, which means it may drop to below $10.

The scenario set out here is a grim prospect, it is true, because of its implications for many aspects of life, but it will considerably easier if you are on the right side of the trade – and we plan to be.
End of update.
Posted at 10.20 am EDT on 17th June 15.
Stock Features of the Week – Abnormal Breaks
Strong price trends usually start with abnormal price moves with abnormal volume. There is a significant change in fundamentals, the people who follow the company closely react by buying aggressively and start the stock moving higher. As more people learn about the change in fundamentals, more people buy and the stock goes in to an upward trend.
Today, I ran a scan for Abnormal Movers and then inspected the charts for signs that investors were surprised by the move. Here is one stock that is worth checking out:
1. SCON
SCON has been quietly moving sideways for a couple of months but is coming alive today with abnormal volume and price action. This is breaking the downward trend line and could be the start of a rebound for the stock. Support at $0.98.

Here is the rest of Tyler’s weekly newsletter titled:
Return on Capital
Stockscores.com Perspectives for the week ending July 20, 2015
In this week’s issue:

In This Week’s Issue:
– Stockscores’ Market Minutes Video – Pull Backs to Trend Lines
– Stockscores Trader Training – Return on Capital
– Stock Features of the Week – Abnormal Breaks
Stockscores Market Minutes Video – Pull Backs to Trend Lines
Opportunities arise when myopic traders sell on weakness to take prices back to the long term upward trend line. Learn that plus Tyler’s regular weekly market analysis with this week’s Market Minutes..Click Here to Watch
Trader Training – Return On Capital
A Stockscores user asked me a question that I think many people have, “If you have more trade opportunities than capital, how do you pick which trades to take?”
The short and simple answer is to take the trades that give you the most bang for your buck. Let me explain.
We size our trade positions based on the risk of the trade. The risk of the trade is the difference between the entry price and the stop loss price. Divide the risk in to your risk tolerance amount and you have the number of shares you can buy.
Consider two trade possibilities, each with strong charts that show the same potential for price appreciation. The first has an entry price of $5 with support, and therefore our stop loss point, at $4.50. That means there is $0.50 of downside, or the potential for a 10% drawdown.
The second trade has an entry price of $20 with a $19 support price and stop loss point. On this trade, if wrong, we stand to lose $1 per share or 5% drawdown, since $1/$20 is 5%.
If we are willing to risk $500 on each trade, we will buy 1000 shares of the $5 stock for a total cost of $5,000 and 500 shares of the $20 stock for a total cost of $10,000. Each trade has the same amount of risk but the second trade requires more capital because the stock is less volatile. That also means the expectation for percentage gain on the second position is also less. The price volatility on the entry signal is a good predictor of what price volatility will be in the trend.
Clearly, the first trade gives more bang for the buck. We can use less capital for the same profit potential. We may believe both trades have the potential to make $1000 but the first trade will do it with half as much money invested. For a trader with limited capital, the first trade is the one to take.
Generally, lower priced stocks will be more volatile on a percentage basis, making them a source of greater percentage gain potential. You can place less capital in to a low priced stock to get the same dollar upside as a higher priced stock trade.
I did a quick survey of this week’s best gainers to confirm this fact. I ranked the 2000 most actively traded stocks in the US last week by percentage gain and focused on the top 20 gainers. Of the top 20, 17 were under $10. The other 3 were under $20.
The lesson here is to focus on lower priced stocks if you have less capital to trade with. Many will argue that these lower priced stocks are riskier and maybe dangerous for a risk averse trader. They are actually not riskier, they are more volatile. That means you have to take a smaller position size in them so that the risk of the trade does not exceed your risk tolerance.
By adjusting position size based on the difference between the entry price and stop loss price, you can make every stock trade have the same amount of risk. If the stock is volatile buy less. If your amount of capital is insufficient for all the trades you find, focus on the lower priced stocks.
There is one caveat to this style of risk management. Lower priced stocks tend to have an added element of risk because they have a greater potential for price gaps. Lower priced stocks tend to have less established or diversified businesses which means a problem with one of their businesses can have a major impact on share price. It is much easier for a small Biotech stock to gap down 30% on bad news than it is for Pfizer to. That means the low priced stocks you trade could blow through your stop loss point if bad news brings a big price gap.
That makes it important to not put all of your capital in to just a few low priced stocks. If you are going to focus on relatively cheap stocks then you must own a number of them so that a larger than expected loss on one of them does not bring your portfolio performance down significantly.
If you have less capital to trade with than what you would like, focus on the lower priced stocks. You can adjust your Stockscores Market Scans to include a price filter for stocks under $10 or even lower if you like. Just remember to size your positions based on the volatility of the stock, the difference between the entry price and support on the chart, where you will put your loss limit. By doing that, you can match the risk of the trade to your risk tolerance and use less capital to gather the same dollar profit potential.
References
- Get the Stockscore on any of over 20,000 North American stocks.
- Background on the theories used by Stockscores.
- Strategies that can help you find new opportunities.
- Scan the market using extensive filter criteria.
- Build a portfolio of stocks and view a slide show of their charts.
- See which sectors are leading the market, and their components.
Disclaimer
This is not an investment advisory, and should not be used to make investment decisions. Information in Stockscores Perspectives is often opinionated and should be considered for information purposes only. No stock exchange anywhere has approved or disapproved of the information contained herein. There is no express or implied solicitation to buy or sell securities. The writers and editors of Perspectives may have positions in the stocks discussed above and may trade in the stocks mentioned. Don’t consider buying or selling any stock without conducting your own due diligence.
Quotable
The boast of heraldry, the pomp of pow’r,
And all that beauty, all that wealth e’er gave,
Awaits alike th’inevitable hour.
The paths of glory lead but to the grave.
Thomas Gray
Commentary & Analysis
Schadenfreude: That buy gold and sell the dollar thing doesn’t seem to be working out
I realize it’s not fair to pile on, but there is a certain joy one experiences when the blather from the cocky prognosticators of dollar doom and gold love are proven so utterly wrong by Mister Market. The German word schadenfreude says it best.
Scientific analysis this is not, but it is interesting, I think…the symmetry meme suggests we may have a couple more years left in this commodity bear market relative to stocks; which likely means we have another couple of years left in this US dollar bull market…but, confident we never should be as every moment in the market is unique (to paraphrase Mark Douglas).
I presented the Stocks/Commodities Ratio chart below, back in May of 2014, during an online webinar titled, US $ Reserve Currency Status: Is the US dollar doomed or is a powerful dollar bull market ready to resume. The chart shows the relationship between financial assets, i.e. stocks, measured by the S&P 500 Index, and real assets, i.e. commodities, measured by the Thomson Reuters Commodities Index. In short, the S&P 500 divided by the Commodities Index. So, when the value goes down, it means commodities are gaining relative to stocks, and vice versa. I said at the time, May of last year, it looked like the 10-year bull market in commodities was clearly over; the S/C ratio was at 6.14. The ratio has since jumped to 9.92; or about 60% (and sitting bang on the 61.8% retracement level—correction time?). Stocks are smoking commodities.
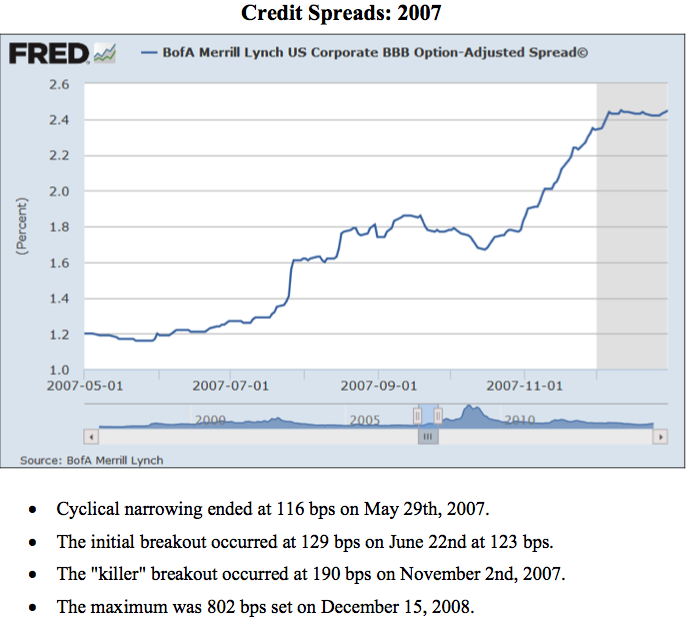
So what drove down the S/C ratio, favoring commodities over stocks, from 1999 to mid-2008? Clearly the insatiable demand for commodities from China and symbiotic relationship it created between the US and China, i.e. China sends stuff, the US sends back dollars, China reinvests those dollars in US Treasuries, dollar liquidity explodes globally (evidenced by the massive US current account deficit).
So what ended the game and drove the S/C ratio higher, favoring stocks over commodities–the Credit Crunch. It was a sea change event in the global economy. It marked the beginning of the new bull market in the US dollar, and we said as much at the time.
And why do I care about the S/C ratio? Because it appears highly correlated with the direction of the US dollar and could give us clues as to when the current dollar bull market has run its course.
Thanks to the elusive gift of hindsight we now all know China was the driver of the commodities bull market. Of course back in 1998-99 not too many realized just how strong the impact of China would have on global markets. And suspect not too many people realized how the symbiotic relationship between China and the US would impact negatively on the US dollar at the time.
So how when and how will this cycle end? If we get symmetry in duration going forward, maybe this cycle runs another 2-3 years. We can conjecture on the future trigger event(s) from now till the cows come home and develop plausible rational scenarios, but we don’t know what it will be. It is likely something already at work beneath the surface, that seen and unseen stuff that Frederic Bastiat warned us about.
But to get a sense of what types of things we should be watching for, let’s look at the key global macro triggers for major trend changes in the US dollar index since the dollar left the gold standard and began trading based on supply and demand factors against the other major currencies.
You will see this chart in the webinar PowerPoint I referred to above; it displays the global macro events, identified with hindsight, which led to a major trend change in the US dollar:
Since the Gold Standard was abandoned in 1971, we have seen three major bear markets in the dollar, all lasting about seven years, and two major bull market moves (the first seven years in duration, the second about 10 years). We are now in the midst of the third major bull market in the dollar, my guess is it carries out to 2018—representing about 10 years.
Macro Events Leading to Change in US Dollar Trend:
- Abandoned Gold Standard – Bear Market
- Fed Chairman Volcker hike rates to squeeze out inflaiton – Bull Market
- Plaza Accord because the dollar was too high (yen too low really) – Bear Market
- Tech Company Boom – Bull Market
- Tech Company Bust/Global Deflation Fear – Bear Market
- Credit Crunch (end of US/China symbiotic relationship) – Bull Market
- _____Unknown Event___________________________ — Bear Market
I realize there are plenty of gurus out there who already know exactly why the US dollar will fall again, and they likely know exactly when it will happen. Here is my tip of the day—they don’t know!
Readers of Currency Currents have seen the boom-bust sequence chart below before. I do believe it does represent how humans drive price action in free- and quasi-free markets; granted it is a very stylized view but still helpful.
- Commodities – Given the news of a 13-year low in the commodities index today, we are into the “fear” stage, but not yet into “despair.”
- The US dollar – We are either late in the “growing convictions” stage or in the beginning of “hubris” stage and setup for overshoot territory.
If the US dollar were to test the highs of that last bull market, we have approximately another 20% to go—that’s a lot.
US $ Index vs. Gold Weekly: Can you say mirror image?

The best way to participate in the US dollar bull market, and its corrections along the way, may be through currency options. And you may want to consider subscribing to our Currency Options Strategist; it is only $395 per year. [Our Canadian dollar put idea is working nicely, as talked about in our last Currency Currents. We are up about 100% based on Friday’s bid price on the option—see below.]
It is simple to use. We tell you when to buy a put or call on a major currency, using exchange listed ETFs. We tell you when to get out and take profit or cut loses. We never use any strategies but “buy a put” or “buy a call” so you always have limited risk and know what that risk is when you make the trade. We use options as simple long-term directional bets on the direction of a major currency against the US dollar.
Current Open Positions: Black Swan Currency Options Strategist.

We are short euro, Aussie, and Canadian dollar in our options service; fortunately all are profitable at the moment. We may look to grab some open gains soon, maybe peel off half profits on some of the positions and let the rest ride for more, i.e. keep some skin in the game.
If you are tired of failed prognostications and one-way hyperbolic bets from the guru crowd and are looking for a service that plays both sides of the US dollar move in an effort to make money for its subscribers and does not pretend it can forecast markets, you may want to give Black Swan Currency Options a try.
Regards,
Jack Crooks
President, Black Swan Capital
Twitter: @bswancap

-
I know Mike is a very solid investor and respect his opinions very much. So if he says pay attention to this or that - I will.
~ Dale G.
-
I've started managing my own investments so view Michael's site as a one-stop shop from which to get information and perspectives.
~ Dave E.
-
Michael offers easy reading, honest, common sense information that anyone can use in a practical manner.
~ der_al.
-
A sane voice in a scrambled investment world.
~ Ed R.
Inside Edge Pro Contributors

Greg Weldon

Josef Schachter

Tyler Bollhorn

Ryan Irvine

Paul Beattie

Martin Straith

Patrick Ceresna

Mark Leibovit

James Thorne

Victor Adair