
Energy & Commodities
There is a lot to go over tonight in regards to commodities and the precious metals complex. A while back I wrote a report on the commodities in general getting ready for the next possible leg down which will fuel the deflationary pressures that really took hold last about this time. That’s when the US dollar finally broke out of its massive base and charged higher topping out in March of this year and has been consolidating those gains ever since. Lets start by looking at the big base the US dollar broke out of last year at this time and the strong impulse move up as shown by the string of white candlesticks. That’s what a strong impulse move looks like when all the pent up energy finally has a change to escape.

….go HERE where you can get much larger charts with the analysis

Forex Trading Alert originally sent to subscribers on July 23, 2015, 9:44 AM.
Earlier today, the U.S. Department of Labor showed that the initial jobless claims in the week ending July 18 dropped by 26,000 to 255,000, beating analysts’ expectations for a 1,000 drop. In this environment, the USD Index bounced off session’s lows and came back above 97. What impact did this move have on the euro, pound and Swiss franc?
In our opinion the following forex trading positions are justified – summary:
- EUR/USD: short (stop-loss order at 1.1058)
- GBP/USD: none
- USD/JPY: none
- USD/CAD: none
- USD/CHF: none
- AUD/USD: none
Before we take a closer look at the EUR/USD, GBP/USD and USD/CHF charts, let’s examine the current situation in the USD Index.
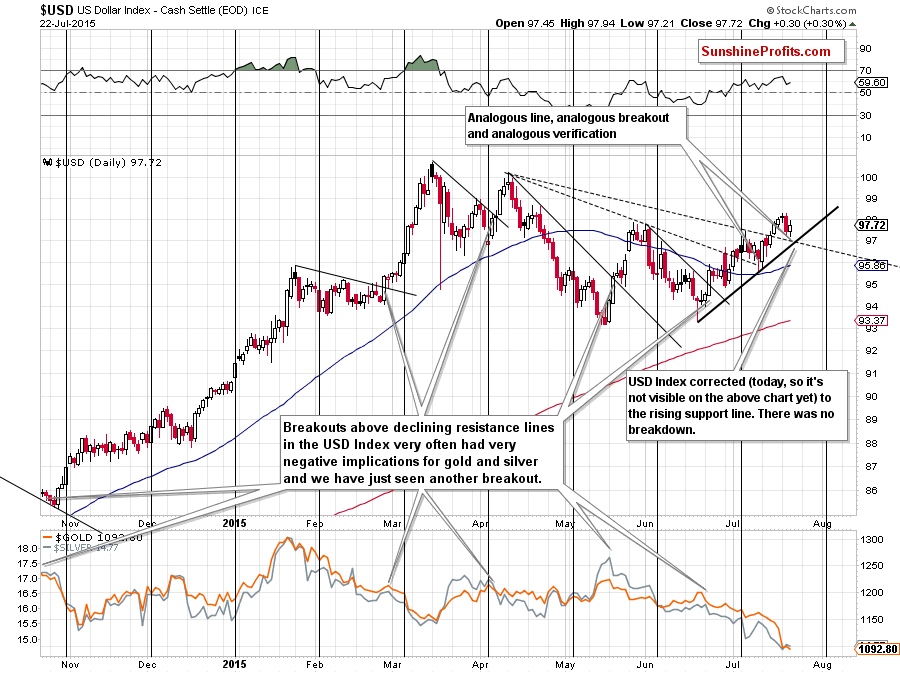
Yesterday, the index approached the black dashed line (based on the Apr 13 and Jul 7 highs), which triggered a rebound to slightly below
98. Earlier today, the U.S. dollar reversed and moved lower once again (it’s not visible on the above chart yet), re-testing not only this support line but also the black rising line based on the Jun 18 and Jul 10 lows (which serves as an additional support at the moment). What impact did it have on the greenback? The USD Index bounced off this area and came back above 97, which suggests higher values of the index – similarly to what we saw on Jul 13 (back then, the dollar moved sharply higher after a drop to analogous lines).
Having said that, let’s take a look at our currency pairs below.
EUR/USD
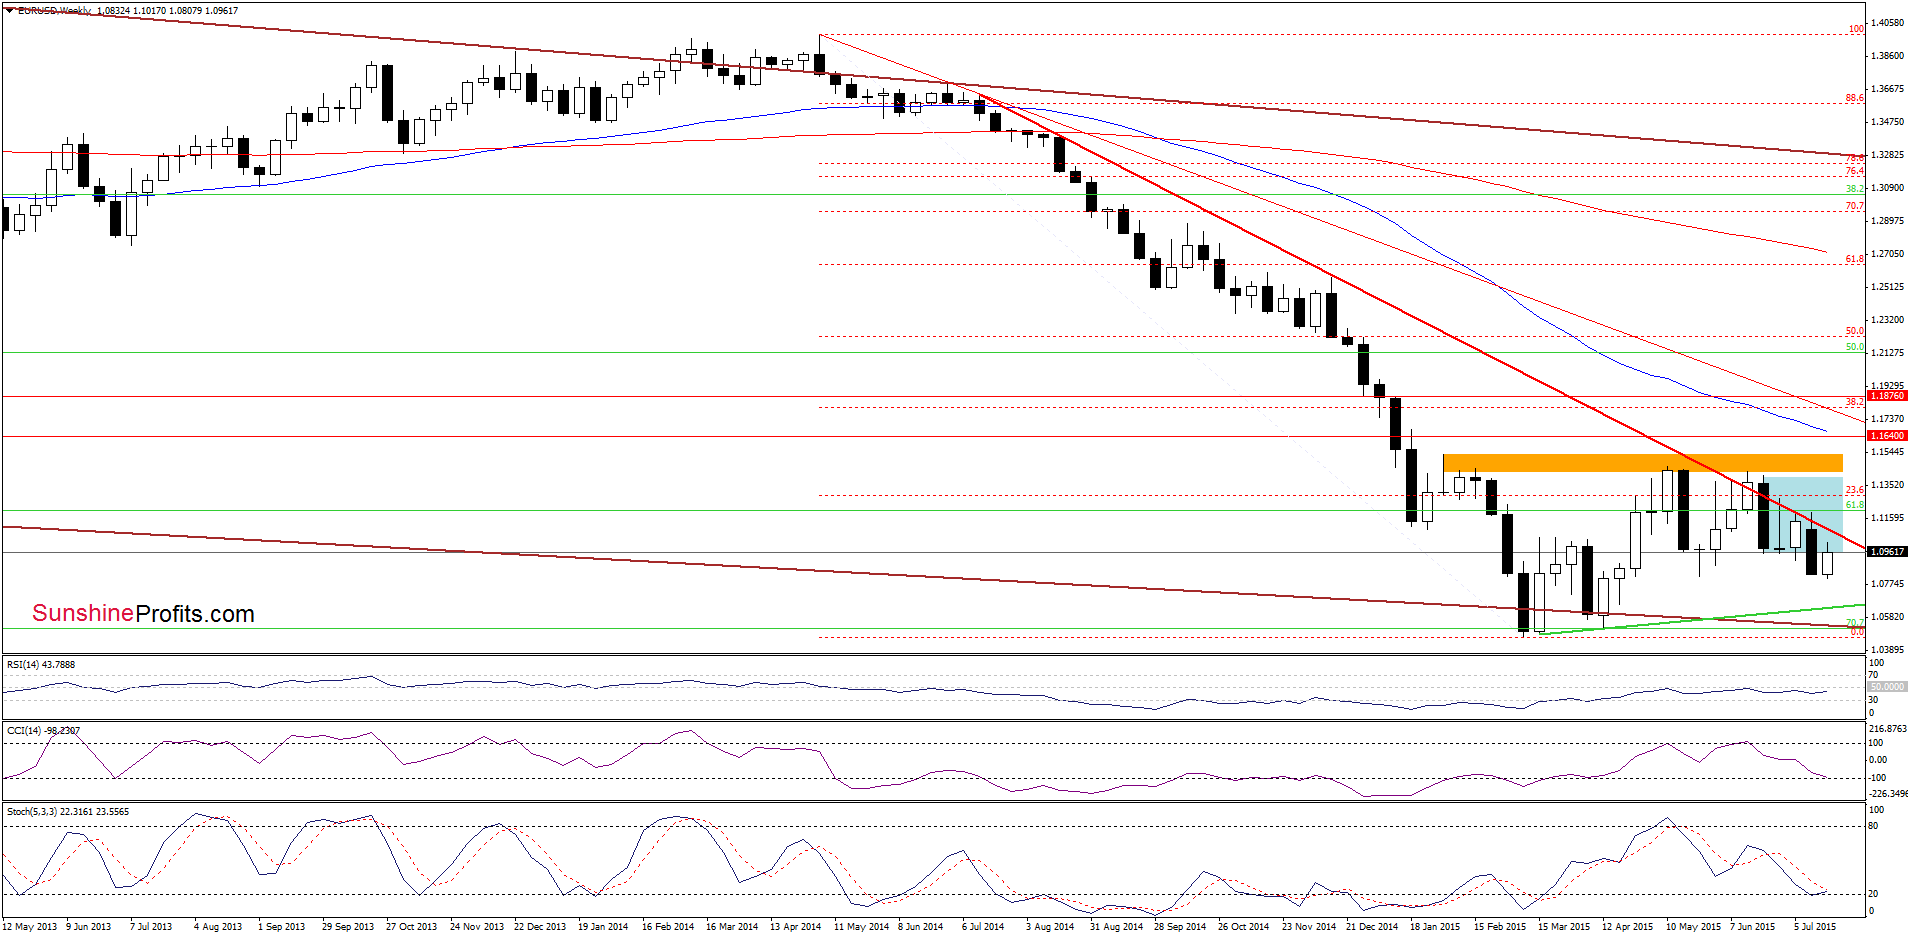
Although EUR/USD moved higher, the pair reversed and slipped under the lower border of the blue consolidation once again, which suggests that currency bulls may not be as strong as it seemed on the first sight.
Will the daily chart give us more clues about future moves? Let’s find out.
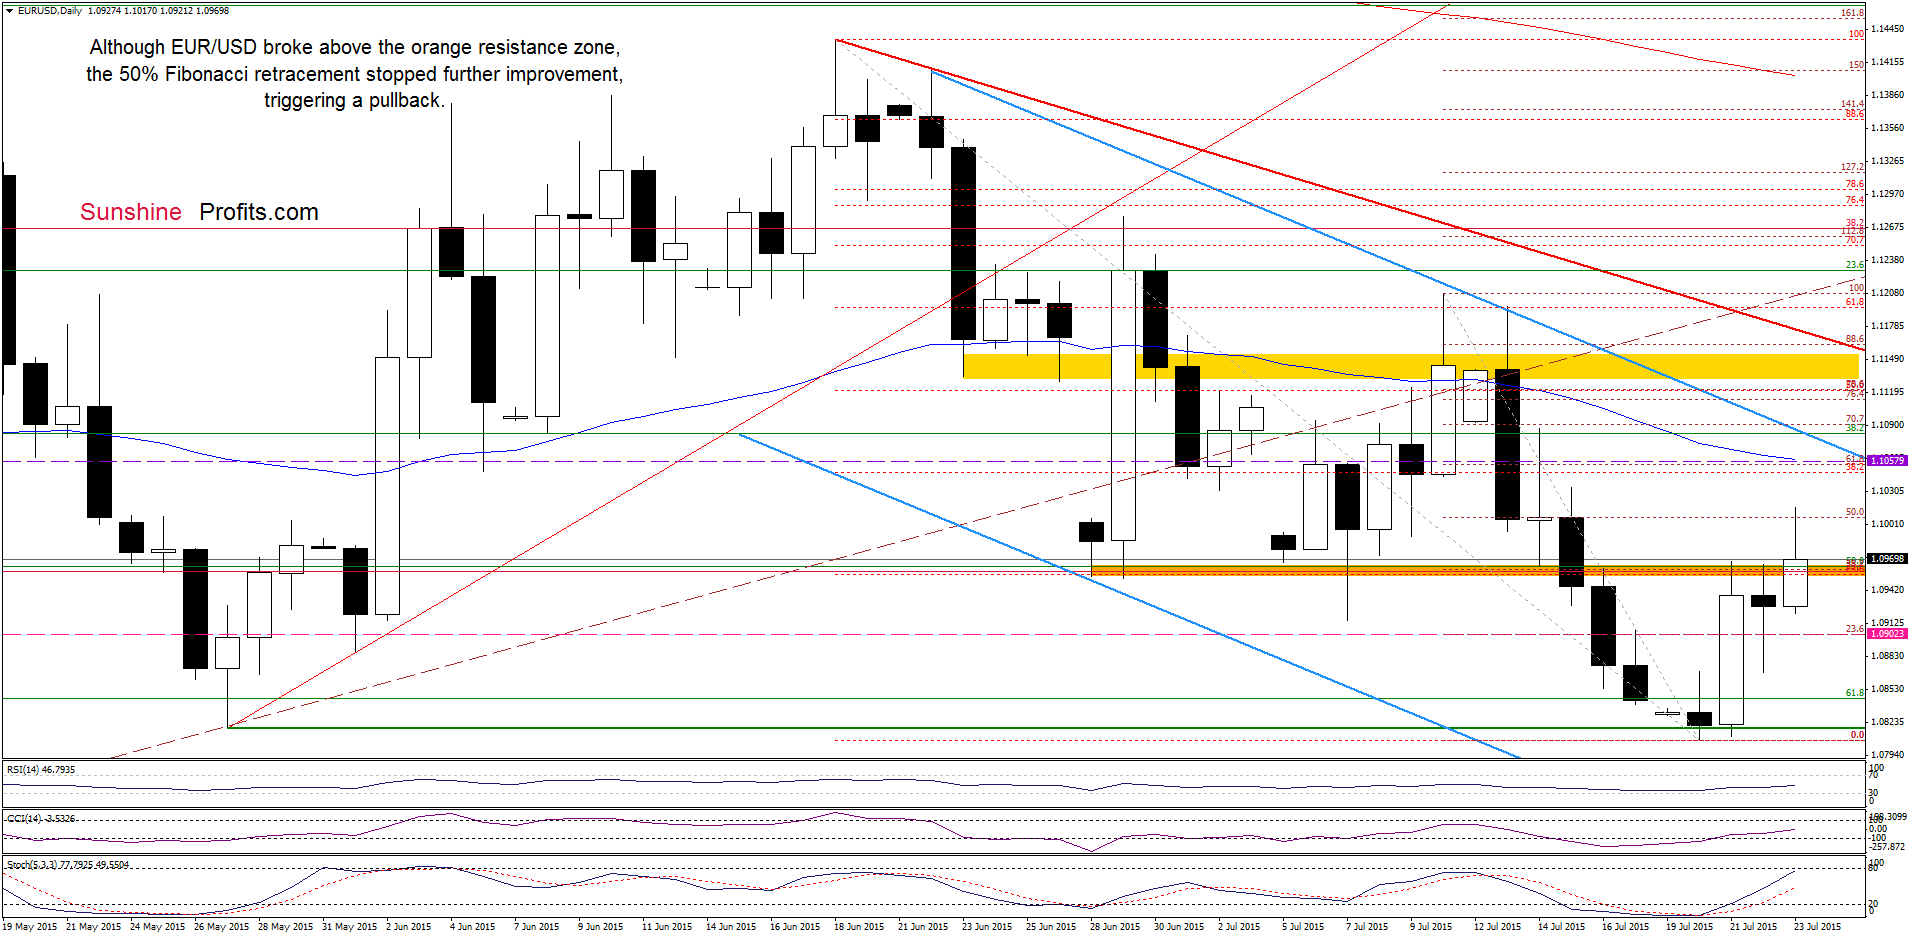
From this perspective, we see that EUR/USD broke above the orange resistance zone and reached the 50% Fibonacci retracement (based on the recent downward move started on Jul 10). Despite this improvement, currency bulls didn’t manage to push the pair higher, which resulted in a pullback to the previously-broken orange zone. What’s next? Although this area could trigger another rebound, we think that the current situation in the USD Index will translate to lower values of the exchange rate. If this is the case, and the pair closes today’s session under the orange area, it would be a bearish signal, which will trigger further deterioration in the coming days.
Very short-term outlook: bearish
Short-term outlook: mixed with bearish bias
MT outlook: mixed
LT outlook: mixed
Trading position (short-term; our opinion): Short positions with a stop-loss order at 1.1058 are justified from the risk/reward perspective at the moment. We will keep you informed should anything change, or should we see a confirmation/invalidation of the above.
GBP/USD
The situation in the medium term hasn’t changed much as GBP/USD is trading between the last week’s high and low. Today, we’ll focus on the very short-term changes.
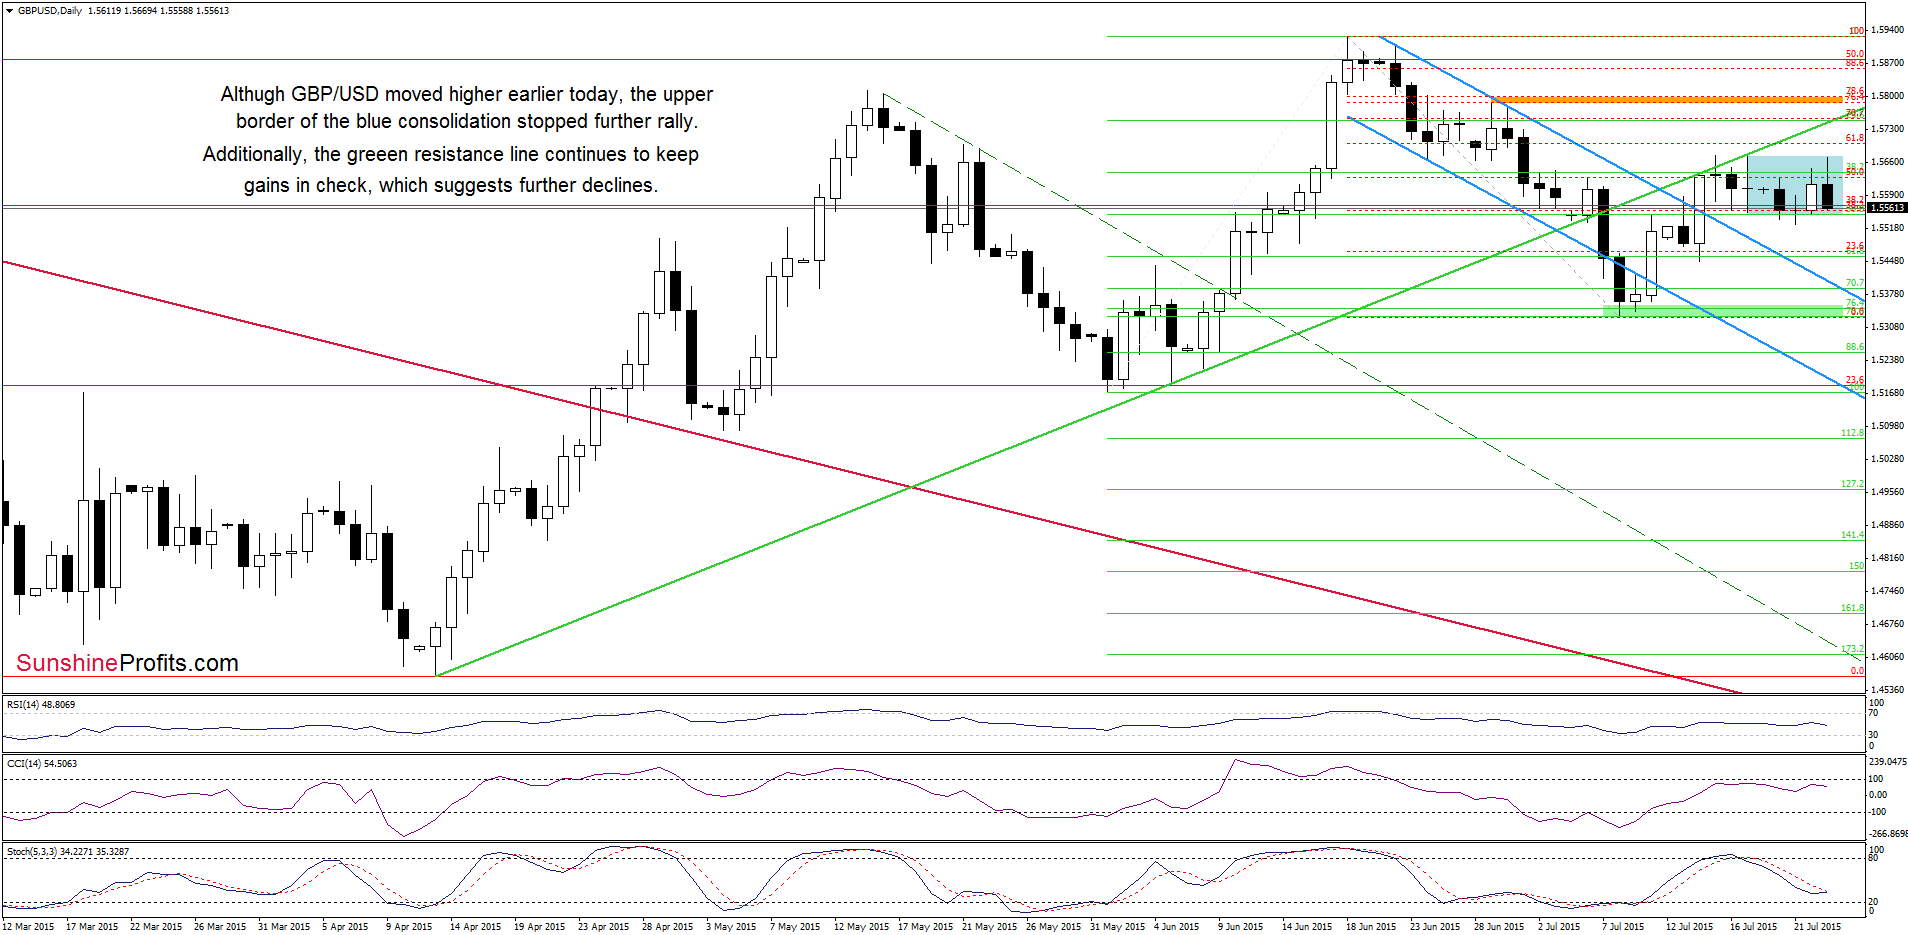
Looking at the daily chart, we see that although GBP/USD moved higher in the previous days, the upper border of the blue consolidation was strong enough to stop further improvement. As a result, the exchange rate moved sharply lower earlier today. What’s next? If the pair drops below the lower border of the blue consolidation, GBP/USD will likely extend losses and we’ll likely see a decline to the previously-broken upper border of the declining blue trend channel (currently around 1.5408) in the coming days.
Very short-term outlook: mixed with bearish bias
Short-term outlook: mixed
MT outlook: mixed
LT outlook: mixed
Trading position (short-term; our opinion): No positions are justified from the risk/reward perspective at the moment. We will keep you informed should anything change, or should we see a confirmation/invalidation of the above.
USD/CHF
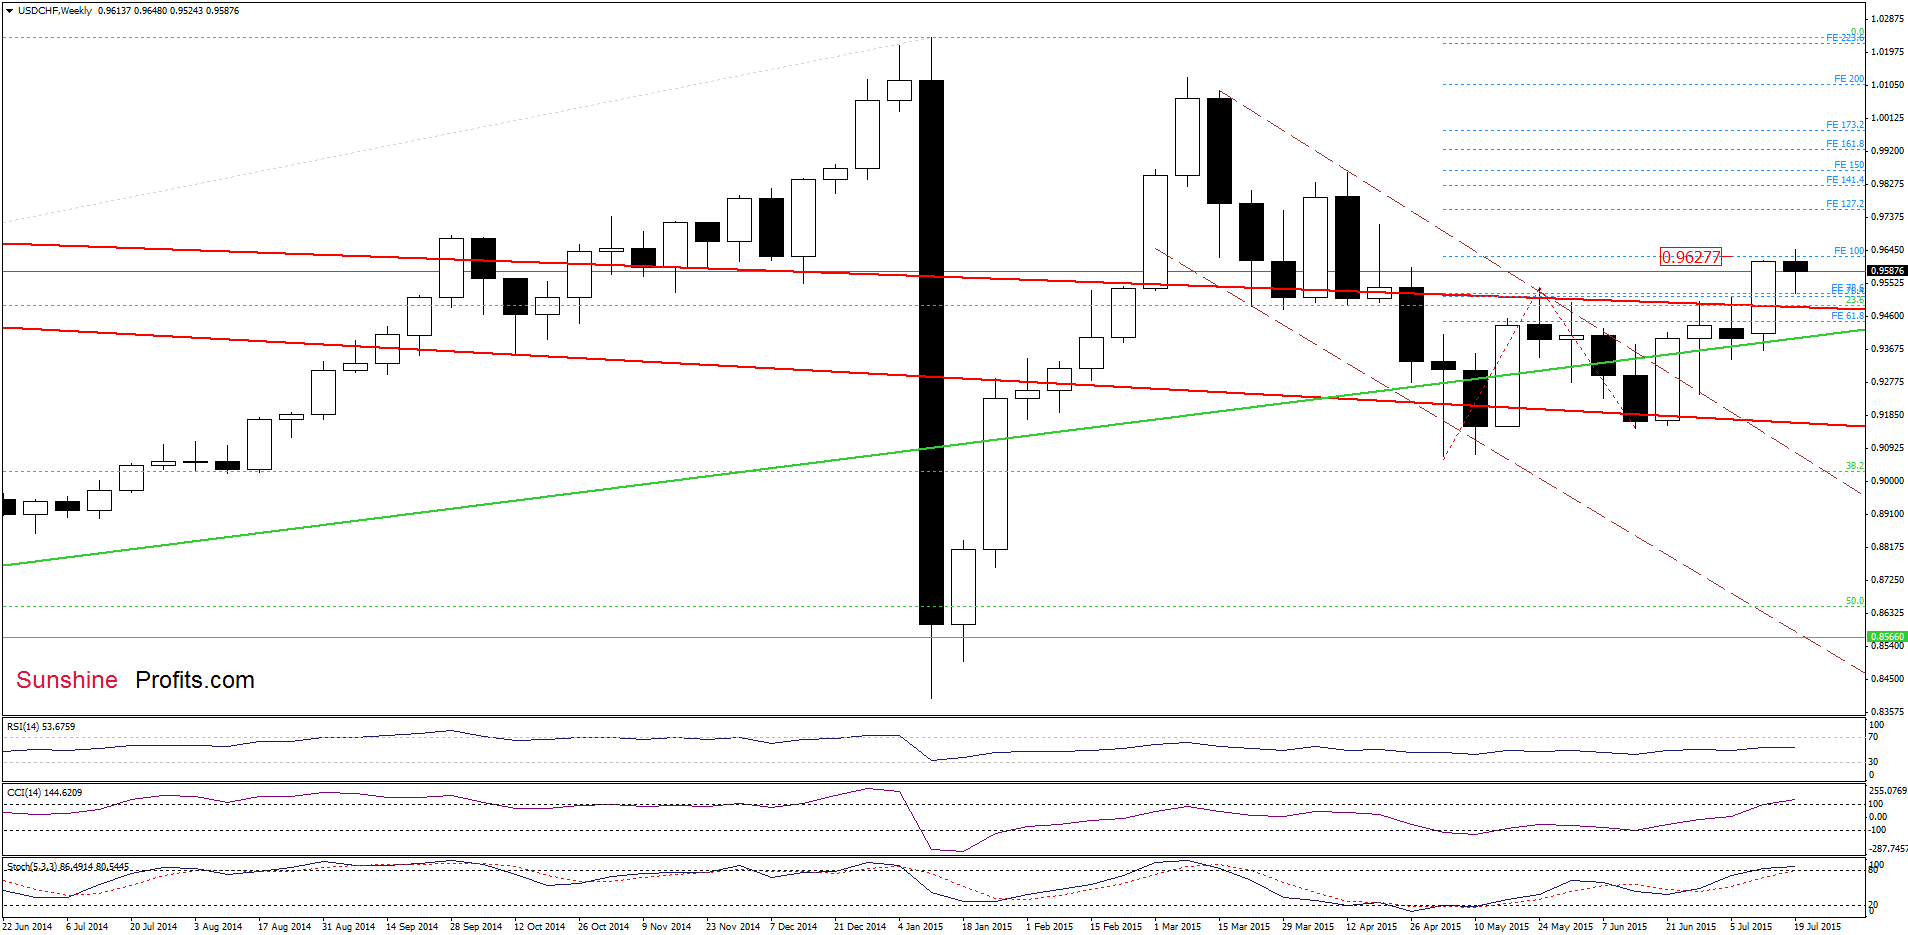
The situation in the medium term has deteriorated slightly as USD/CHF reversed and declined after an increase above the 100% Fibonacci price projection (marked with blue). What impact did this move have on the very short-term picture? Let’s check.
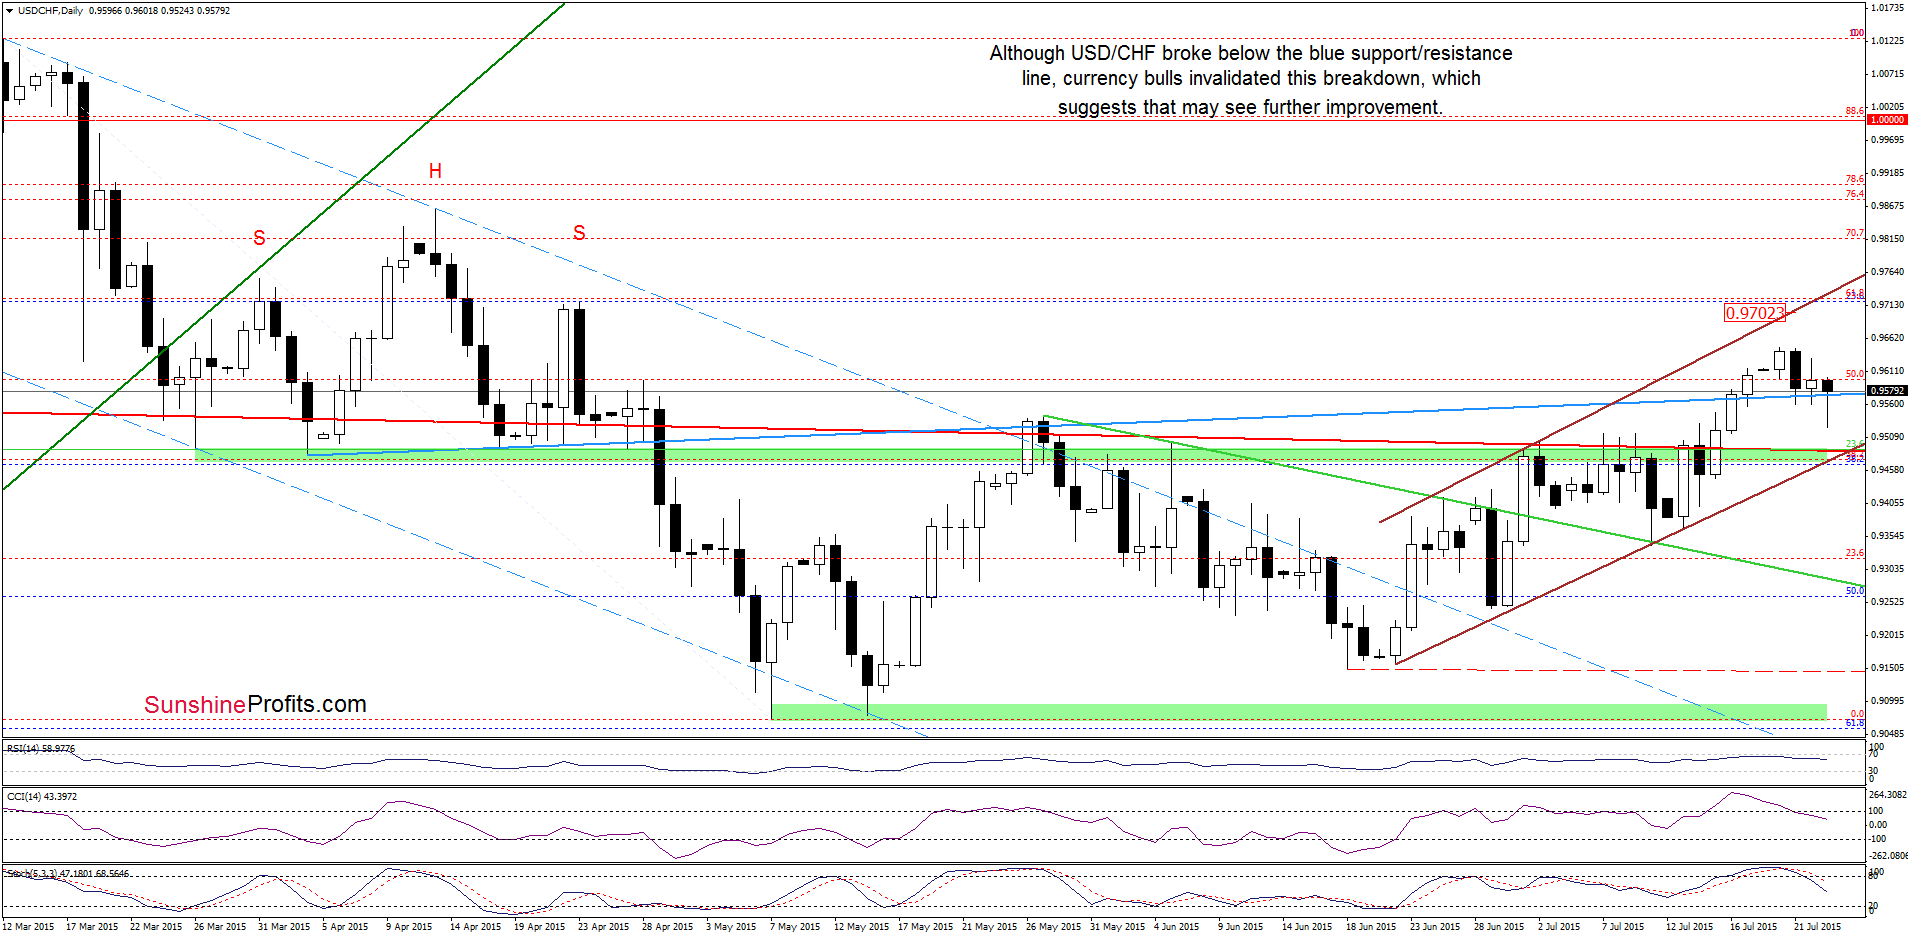
On the above chart, we see that USD/CHF moved lower in recent days, which resulted in a drop below the previously-broken blue support/resistance line. Despite this move, currency bulls managed to stop their opponents and the pair rebounded earlier today. With this upswing, the pair invalidated small breakdown under the blue line, which is a positive signal that suggests further improvement. Nevertheless, such price action will be more likely (and reliable), if we see a daily close above the blue line (currently at 0.9575).
Very short-term outlook: mixed
Short-term outlook: mixed
MT outlook: mixed
LT outlook: mixed
Trading position (short-term; our opinion): No positions are justified from the risk/reward perspective at the moment. We will keep you informed should anything change, or should we see a confirmation/invalidation of the above.
Thank you.
Nadia Simmons
Forex & Oil Trading Strategist
Przemyslaw Radomski, CFA
Founder, Editor-in-chief
Gold & Silver Trading Alerts
Forex Trading Alerts
Oil Investment Updates
Oil Trading Alerts

 That’s Citi, protesting. We’ll leave it to you to decide if it’s too much:
Sentiment indexes are in despair and investors want to get more bearish still — It is rather strange that an asset class which is already in despair according to our sentiment indicators, and where valuations range from 1 stdev-below-mean to mean in terms of P/BV, and yet fails to generate much investor interest. On the contrary, as sentiment has worsened and valuations have fallen, investors have become more dismissive of the asset class. This is no truer than when it comes to the China. A market, which is either in a bubble or collapsing, and sometimes doing both the same day according to the bears….
The Chinese market corrects and the bears come out of hibernation all at once. Having been temporarily silenced by the rising market, all one needs to do is open a reputable newspaper or look at Bloomberg and you’ll get your fill of China doom and gloom. And while the momentum is down, why not extend the pessimism to all EM, which after all is just one big China trade anyhow? China and the EM asset class is doomed and for all the pulp and paper in the world there aren’t sufficient hankies in the world to mop up this mess, it would seem.
…related:
Quickly revisiting those dodgy China growth stats

USDCAD Overnight Range 1.2950-1.3045
A strong and much needed rebound in Canadian Retail Sales data for May (Actual 1.0% vs. forecast 0.5%) provided the Loonie with an ever-so-modest and extremely short lived gain this morning. USDCAD dipped about 0.0010 points to 1.2957 and then reversed course and is now above 1.3000 again. That’s because the data is considered “stale”. Meanwhile today’s weekly US Jobless claims report was released at the same time and it is fresher and therefore relevant. Jobless claims declined to 255,000 and refocused traders on the prospect for a September rate hike. The US dollar gained across the board.
Overnight saw a continuation of the previous day’s US dollar sell-off. Kiwi dominated the Asian session. The RBNZ delivered the expected 25 bp rate cut and in a classic “sell-the-rumour, buy-the –fact” move NZDUSD rallied to 0.6690 from 0.6570.
European FX trading was choppy albeit with lower than usual volumes. The EURUSD jump to 1.1000 from 1.0925 left traders scratching their heads for a reason.The jobless claims data drove EURUSD back to 1.0960. In Britain, a poor UK retail Sales report triggered a dive in GBPUSD and it hasn’t recovered.
The prospect of lower oil prices and higher US rates will limit any near term USDCAD losses. WTI is in a downtrend while trading below $50.52/bbl with yesterday’s breach of support at $49.70 expected to cap intraday gains. September is still the favoured month for a US rate increase, reinforced by today’s jobless claims data.
Technical Outlook
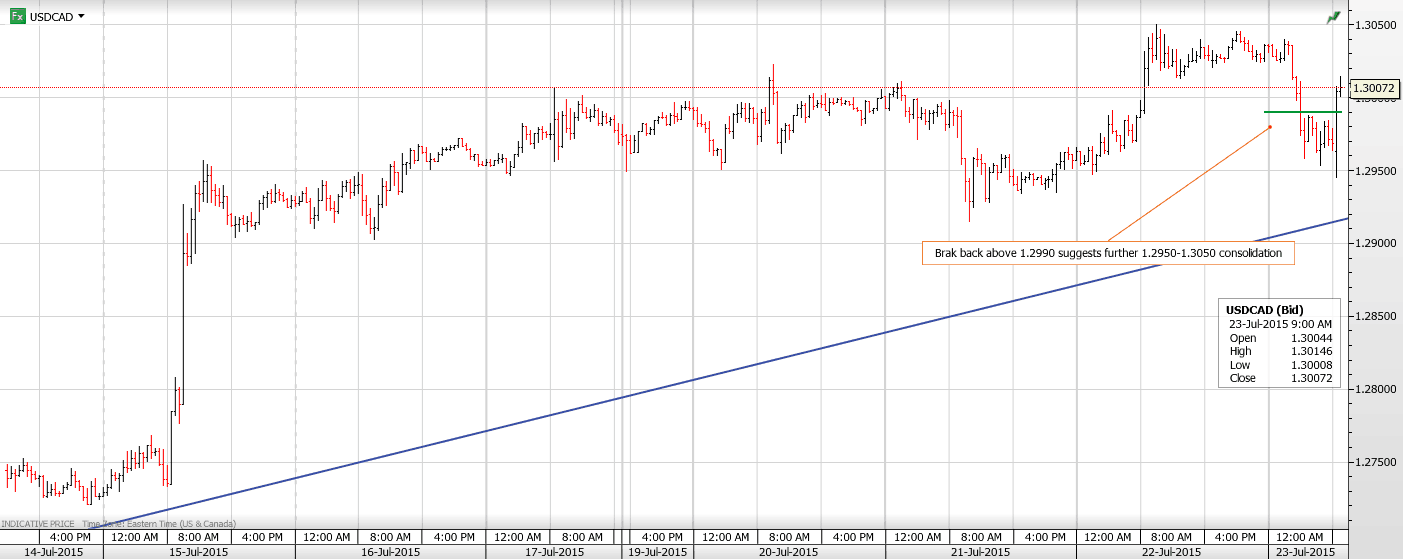
The USDCAD intraday technicals have flipped back to bullish following this morning’s failure to extend losses below 1.2950 and its subsequent rally above intraday resistance at 1.2990 argues for additional 1.2950-1.3050 consolidation. The uptrend from the beginning of the month remains intact while trading above the 1.2900-30 area.
Today’s Range 1.2960-1.3020
Chart: USDCAD 30 minute showing break of intraday resistance Larger Chart

 THE OTHER MARKETS


-
I know Mike is a very solid investor and respect his opinions very much. So if he says pay attention to this or that - I will.
~ Dale G.
-
I've started managing my own investments so view Michael's site as a one-stop shop from which to get information and perspectives.
~ Dave E.
-
Michael offers easy reading, honest, common sense information that anyone can use in a practical manner.
~ der_al.
-
A sane voice in a scrambled investment world.
~ Ed R.
Inside Edge Pro Contributors

Greg Weldon

Josef Schachter

Tyler Bollhorn

Ryan Irvine

Paul Beattie

Martin Straith

Patrick Ceresna

Mark Leibovit

James Thorne

Victor Adair