
Gold & Precious Metals
The leveraged gold futures derivatives market is knocking down the precious metal, yet in massive contrast, this drop has ignited a shopping frenzy according to gold coin dealers. I spoke with several friends and industry experts last week who confirmed the record sales numbers for the month. In fact, American Gold Eagle sales reached 161,500 ounces in July, the highest monthly figure since April 2013. What gives?
Gold often attracts conspiracy theories when it falls so abruptly, especially on Mondays. Interestingly, in a recent article on Zero Hedge, ABC Bullion out of Sydney, Australia, details some of the speculation behind the precious metal’s beatdown, which I’ve also discussed in my blog.
Price manipulation, or a “bear raid,” could be a factor. Two weeks ago, gold prices experienced a mini “flash crash”—the first one in 18 months—after five tonnes of the metal appeared on the Shanghai market. Whether front-running or fat fingers are to blame, the sell order for what many are calling a bear raid was initially thought to have originated in China, but we now believe it came from New York City.
Did investors anticipate China’s negative flash purchasing managers’ index (PMI) last week? China is the largest consumer of gold, and the PMI is a useful leading indicator of commodities demand as well as job growth.
What about the Greek crisis? This type of debt fear crisis often has the effect of boosting the price of gold, but we didn’t see that happen. Did European central banks sell gold down to dampen the psychological impact of the event? Understating the seriousness of the debt crisis may have prevented investors from seeking gold as protection.
Conspiracy theories or not, I believe none of this tarnishes gold’s sustainable allure. It’s important to look at the two key demand drivers for gold: the Fear Trade and the Love Trade. The Fear Trade is related to money supply and negative real interest rates. The Love Trade comes from the purchase of gold due to cultural affinity and the rising GDP per capita in Asia and the Middle East.
I’ve always advocated, and continue to advocate, a 10 percent weighting: 5 percent in gold stocks and 5 percent in bullion, then rebalance every year.
From Crisis to Opportunity
Take a look at the chart, which shows that the bearish trend is obvious.

And yet many investors are still buying. In an interview last week with Money Metals Exchange and in talking to Bart Kitner, founder of Kitco, both conversations confirmed that smart investors are enthusiastically buying gold during this downdraft in prices.
Rational Investors Know a Deal When They See One, and Feel One
 With so much gloom and doom in the media surrounding gold right now, you might wonder why coin sales are soaring at multiyear highs. The reason is pretty simple: Gold is on sale.
High net worth individuals and other savvy investors realize that even now, as herds of people are rushing for the exit, owning gold is one of the best ways to manage systemic risk. They follow that Greeks had their cash in banks frozen as it was in Cyprus only a few years ago.
Ray Dalio, founder of Bridgewater Associates, said it best: “If you don’t own gold, you know neither history nor economics.”
Indeed, some investors fail to take a long-term perspective on gold. Their sentiment toward the metal extends only as far back as the most recent selloff, induced by the strong U.S. dollar, weak global manufacturing activityand fears that interest rates will soon rise.
Many investors have that “sinking feeling” with a deterioration in global PMI, leading economic indicators, falling commodity prices and the threat of rising U.S. interest rates. Many have raised their cash levels due to decelerating global growth prospects. I’ve written that bad news is good news because when governments accelerate monetary policy, this can be a good opportunity for investors to add to their gold exposure.
 I’m not the only one who takes this position. Besides the investors gobbling up American Gold Eagles, central banks around the world continue to buy, hold and repatriate bullion. The U.S. Federal Reserve maintains its 8,133 tonnes, the most of any central bank. Germany, the Netherlands and other countries have brought home mounds of the yellow metal in the last 12 months. China has increased its reserves 60 percent in the last six years. And Texas is in the early stages of establishing its own gold depository, the first state to do so. If there were no faith left in the metal, why would banks even bother with it?
At the same time, massive amounts of paper money are still being printed. In fact, the International Monetary Fund has asked the Bank of Japan to be ready to increase its monetary stimulus further, according to Bloomberg. Let the paper printing roll! In the U.S., where quantitative easing was supposed to have ended back in October, the Fed’s balance sheet is still within 0.3 percent of its all-time high, according to Sovereign Man.
Based on Historical Volatility Models Gold Is Extremely Oversold
Before the bottom fell out, gold’s support seemed to have been around $1,150, whereas the resistance trend line was breaking down. The descending triangle pattern, seen below, indicates that demand was weakening and downside momentum was gathering force.

A useful tool that traders and analysts use is Bloomberg’s relative strength indicator (RSI). Below is gold’s RSI over the same one-year period. It shows that gold has passed below the 30 mark into oversold territory. When this happens, many analysts see it as a buying opportunity. Between November 3—the last time gold fell this significantly below 30—and January 20, the yellow metal ended up rallying 13 percent.

A similar tool we use to identify buy and sell signals is the price oscillator, which I often explain while speaking at conferences. This tool measures how many standard deviations an asset’s value has moved from its mean (and in which direction). When the number crosses above two standard deviations, it’s often interpreted as an opportunity to take some profits, and when it crosses below negative two, it might be a good time to think about accumulating.

Love Trade and Fear Trade: Gold’s Tailwinds and Headwinds
 I always look at two demand factors for gold, the Fear Trade and the Love Trade. The Love Trade is the purchase of gold for weddings, anniversaries and cultural celebrations while the Fear Trade is gold’s reaction to monetary and fiscal policies, particularly real interest rates.
Historically, the Love Trade has been on the upswing starting around this time—late July and early August—in anticipation of international festivals and holidays such as Diwali, Christmas and the Chinese New Year. But as you can see in the oscillator chart above, gold is down 1.4 standard deviations for the 10-year period. This suggests gold may be at an attractive level to accumulate, and gold stocks can offer greater Beta when gold begins to revert to its mean.
The Fear Trade, on the other hand, involves the Fear Trade and real interest rates (inflation – CPI = real interest rates). Several times in the past I’ve explained how gold tends to benefit when real interest rates turn negative. When the rate of inflation exceeds the yield on a five-year Treasury note, it makes gold much more attractive to many investors.
At this time, the five-year Treasury yield sits at 1.58 percent while inflation is crawling along at 0.1 percent. This means that real rates are a positive 1.48 percent—a headwind for gold. As I told Daniela Cambone during last week’s Gold Game Film, the U.S. has some of the highest real rates of return in the world right now.
To see gold gain traction again, not only do we need to see negative real interest rates in the U.S. we need to see rising real GDP per capita in China and rising PMI in China.
On a final note, there appears to be a battle between the debt markets and equity markets. The debt market yields suggest rates will not be rising next month or quarter, while equity markets suggest they will. I think the bond market is more accurate. With a struggling global economy and commodity deflation odds favor rates will not rise soon in America, and gold will revert back to the mean.
![]()
###
 Aug 3, 2015
Frank Holmes
website: www.usfunds.com

Trading position (short-term; our opinion): Short positions with a stop-loss order at $65.23 are justified from the risk/reward perspective.
On Tuesday, crude oil moved higher after the market’s open supported by hopes for another decline in U.S. stockpiles. Thanks to these circumstances, light crude bounced off the multi-month low and gained 1.48%. Did this increase change anything in the short-term picture of the commodity?
Yesterday, the Shanghai Composite Index increased by more than 3%, which in combination with expectations that the API and EIA reports would show another decline in domestic crude oil inventories supported the price of light crude. As a result, crude oil reversed and bounced off Monday’s low. What impact did this move have on the short-term picture of crude oil? (charts courtesy of http://stockcharts.com).

The first thing that catches the eye on the above chart is an invalidation of the breakdown below the green support line based on the previous lows. This positive event encouraged oil bulls to act, which resulted in a rally to an intraday high of $46.23. But did this move change anything in the short-term picture? Not really. The reason? Firstly, yesterday’s upswing is much smaller than previous upward moves (marked with blue). Secondly, the size of volume that accompanied Tuesday’s increase is much smaller compared to what we saw in recent days. Thirdly, and most importantly, the commodity remains under the previously-broken Apr low and the 78.6% Fibonacci retracement. Therefore, what we wrote in our previous commentary is up-to-date:
(…) we believe that as long as crude oil remains below $46.72-$47.05 all upswings would be nothing more than a verification of the breakdown under the previously-broken Apr low and the 78.6% Fibonacci retracement. Therefore, in our opinion, lower values of the commodity are just around the corner (especially when we factor in the rising size of volume in the previous days, which reflects the growing strength of oil bears).
Summing up, although crude oil moved little higher, the commodity is trading under the previously-broken Apr low, which means that the downtrend remains in place and suggests that lower values of the commodity are still ahead us.
Very short-term outlook: bearish
Short-term outlook: bearish
MT outlook: bearish
LT outlook: bearish
Trading position (short-term; our opinion): Short positions with a stop-loss order at $65.23 are justified from the risk/reward perspective.
Oil Trading Alert originally published on Aug 5, 2015, 5:33 AM

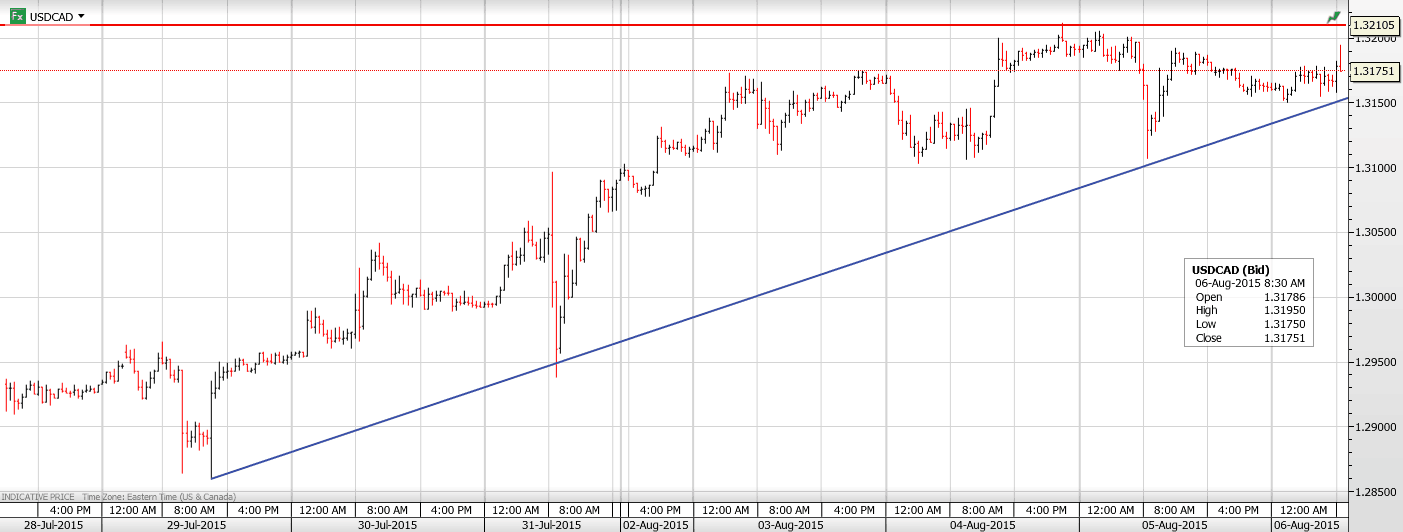
USDCAD Range 1.3155-1.3194
USDCAD drifted within a narrow range overnight, unable to extend gains above 1.3200 and unwilling to retreat. The USDCAD strength is impressive in the face of yesterday’s greatly improved Canadian trade report which may be seen as a sign the domestic economy can be taken off of life support. On the other hand, the data is over a month old and traders are more focussed on the slide in oil prices. A break below $42.00/00 could turn nasty for both oil and the Loonie. Today’s Jobless claims report was close to forecasts and a non-event
Australia was the story in Asia but only briefly. A jump in job gains gave AUDUSD a short term boost which was quickly reversed without any apparent reason. USDJPY continued to flirt with 125.00.
GBPUSD got crushed in early New York trading. The MPC vote to keep monetary policy unchanged was widely expected to be 7-2 (some even thought 6-3) after Mark Carney’s hawkish comments on July 17th. The 8-1 result caught the market long Sterling and positions were quickly cut. GBPUSD plunged from 1.5625 to 1.5470 in minutes.
Canadian and US. employment reports are due tomorrow which is enough incentive for traders to sit on the sidelines, ensuring a quiet day ahead.
Technical Outlook
The intraday technicals are bullish while trading above 1.3150 with a break of 1.3200 likely to extend gains to 1.3300. A break of intraday support at 1.3150 will lead back to 1.3110. Longer term, the USDCAD uptrend remains intact above 1.3005. For today, USD support is seen at 1.3150 and 1.3110. Resistance is at 1.3210 and 1.3240
Today’s Range 1.3150-1.3205
Chart: USDCAD 30 minute with uptrend and resistance shown Larger Chart

Last week, I stated the market was approaching a fairly important decision point. To wit:
“As shown in the chart below, the market has been remained trapped in a tightening pattern of higher lows and lower highers. This type of action is like the compression of spring. In the next few days, the markets will make an important decision. A breakout to the upside of this consolidation will confirm the current bullish trend, and portfolio actions should remain allocated and tilted more heavily towards equity related risk. However, a break to the downside will likely suggest a more significant correction in the near term. It is worth noting that this consolidation in the market is happening during a decline of relative strength. This is a warning sign that generally bodes poorly for the bulls.”
(Note: The chart has been updated to Friday’s close to show the breakout of that consolidation.)

“Since portfolios are currently fully allocated to the market, if the market breaks out to the upside of the current consolidation this will simply confirm that the “bulls” are still currently in charge of the market. No action will be required.”
As shown, that breakout did occur this past Friday,which suggests that the bullish trend is still intact and that portfolios should remain currently tilted towards equity exposure.
However, this does NOT mean that all market risk is now resolved, or that investors should return to their complacent slumber.
As discussed in this past weekend’s missive the market is currently more overbought now that at any other point in history going back to 1940.

The vertical dashed white lines show that when the extreme overbought condition begins to decline it is coincident with past historical peaks in the market. Furthermore, the long term MACD (moving average convergence divergence) has also turned down which has also historically aligned with more significant market peaks and corrections.
Importantly, this overbought indication is “longer-term” in nature and is slow to move. This means that in the short-term, stocks can, and most likely will, continue to try and advance further due to underlying price momentum. As I have discussed previously:
“The effect of momentum is arguably one of the most pervasive forces in the financial markets. Throughout history, there are episodes where markets rise, or fall, further and faster than logic would dictate. However, this is the effect of the psychological, or behavioral, forces at work as ‘greed’ and ‘fear’ overtake logical analysis.
This is the basic application of Newton’s Law Of Inertia, that states ‘an object in motion tends to remain in motion unless acted upon by an unbalanced force.’ In other words, when markets begin strongly trending in one direction, that direction will continue until an ‘unbalanced’ force stops it.”
Currently, with Central Banks fully engaged in monetary interventions on an unprecedented global scale, there is seemingly nothing that can stop the current advance. Of course, it is that very “thought process” that has been a hallmark of exuberant markets in the past.
Margin Debt Strikes New High
Along with the markets currently being more overbought now than at any other point in history, they are also more leveraged as well.
Late last week the NYSE released its latest margin debt figures for March. Despite a rather sluggish market, investors piled on margin debt pushing levels to all-time highs as shown below.

It is worth noting that when net credit balances have plunged very negative levels it has been coincident with major mean reverting events in the market.
While “this time could certainly be different,” the reality is that leverage of this magnitude is “gasoline waiting on a match.” When an event eventually occurs, that creates a rush to sell in the markets, the decline in prices will reach a point that triggers an initial round of margin calls. Since margin debt is a function of the value of the underlying “collateral,” the forced sale of assets will reduce the value of the collateral further triggering further margin calls. Those margin calls will trigger more selling forcing more margin calls, so forth and so on.
Notice in the chart above that margin debt reductions begins innocently enough before accelerating sharply to the downside.
Tending The Garden
The combined overbought, overleveraged condition of the financial markets is of extreme risk to investors currently. While the bullish trend remains intact currently, it is extremely prudent to perform some risk management in portfolios. As discussed this past weekend:
“…it is worth remembering that portfolios, like a garden, must be carefully tended to otherwise the bounty will be reclaimed by nature itself. If fruits are not harvested (profit taking) they ‘rot on the vine.’ If weeds are not pulled (sell losers), they will choke out the garden. If the soil is not fertilized (savings), then the garden will fail to produce as successfully as it could.
So, as a reminder, and considering where the markets are currently, here are the rules for managing your garden:
1) HARVEST: Reduce “winners” back to original portfolio weights. This does NOT mean sell the whole position. You pluck the tomatoes off the vine, not yank the whole plant from the ground.
2) WEED: Sell losers and laggards and remove them garden. If you do not sell losers and laggards, they reduce the performance of the portfolio over time by absorbing ‘nutrients’ that could be used for more productive plants. The first rule of thumb in investing ‘sell losers short.’
3) FERTILIZE AND WATER: Add savings on a regular basis. A garden cannot grow if the soil is depleted of nutrients or lost to erosion. Likewise, a portfolio cannot grow if capital is not contributed regularly to replace capital lost due to erosion and loss. If you think you will NEVER LOSE money investing in the markets…then STOP investing immediately.
4) WATCH THE WEATHER: Pay attention to markets. A garden can quickly be destroyed by a winter freeze or a drought. Not paying attention to the major market trends can have devastating effects on your portfolio if you fail to see the turn for the worse. As with a garden, it has never been harmful to put protections in place for expected bad weather that didn’t occur. Likewise, a portfolio protected against ‘risk’ in the short-term, never harmed investors in the long-term.”
With overall market trend still bullish, there is little reason to become overly defensive in the very short-term. However, I have this nagging feeling that the “spring” is now wound so tightly, that when it does break loose, it will likely surprise most everyone.

Marc Faber of the Gloom, Boom & Doom Report discusses his concerns about the markets. Watch Trish Regan talk about Economy on Intel Trish Regan.

Marc Faber is an international investor known for his uncanny predictions of the stock market and futures markets around the world.Dr. Doom also trades currencies and commodity futures like Gold and Oil.

-
I know Mike is a very solid investor and respect his opinions very much. So if he says pay attention to this or that - I will.
~ Dale G.
-
I've started managing my own investments so view Michael's site as a one-stop shop from which to get information and perspectives.
~ Dave E.
-
Michael offers easy reading, honest, common sense information that anyone can use in a practical manner.
~ der_al.
-
A sane voice in a scrambled investment world.
~ Ed R.
Inside Edge Pro Contributors

Greg Weldon

Josef Schachter

Tyler Bollhorn

Ryan Irvine

Paul Beattie

Martin Straith

Patrick Ceresna

Mark Leibovit

James Thorne

Victor Adair