
Stocks & Equities
For many moons, Larry Edelson, Mike Larson and I have been alerting you to a series of upcoming disruptions and dangers overseas — wars, revolutions, recession, and chaos.
We told you they would spread; and they have.
We predicted they would drive wave after wave of flight capital to our shores, and they have.
Plus, we pinpointed the most obvious, most immediate, victims of those disasters — investors who plowed their money into emerging market countries. And now, those investors are getting killed in a series of disastrous stock declines:
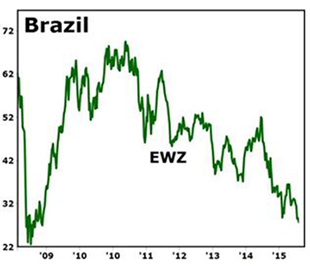 Brazil has suddenly flip-flopped from a miracle economy to a basket case.
Brazil’s service sector, once robust, has just suffered its largest fall since early 2009.
Overall economic activity is falling at an estimated annual rate of almost 5%.
The Brazilian currency — the real — has lost half its value.
And a massive corruption scandal, which began with Brazil’s oil giant Petrobras, has now spread fear to the boardrooms of dozens of the country’s largest corporations.
Result: EWZ, the once-high-flying ETF that represents Brazil’s largest companies, has suffered a long-term plunge from over 99 to a recent low of 27 — a wipe-out decline of almost 72%.
Moreover, it is now approaching the extreme low it made back in the depth of the 2008 bear market.
If that level is broken, look out below!
South Korea, recently a darling of global investors, has suddenly been cast as one of the dogs.
Youth unemployment has crept up to record highs.
 The working-age population, which, until recently had made South Korea an export powerhouse, is shrinking.
And among Korea’s elderly, poverty is the worst of all 34 countries that belong to the Organization for Economic Cooperation and Development (OECD).
For all these reasons — and more — EWY, the ETF specialized in South Korea’s blue chips, took a beating in 2014, rallied, and has now taken an even bigger beating in 2015.
Malaysia, another recent “miracle” economy, has been hit even harder:
Its currency, the ringgit, has crashed to its lows of the late 1990s.
Its central bank, desperate to prevent an even more dramatic currency crash, is depleting its foreign currency reserves.
 Adding corruption to the mix, the government’s giant investment fund — 1MDB — is under investigation over allegations of a massive misappropriation.
The biggest blow of all: The global oil-price plunge, gutting Malaysia’s largest source of revenues.
So it’s no wonder that the ETF devoted to Malaysia’s leading stocks has also been smacked down, busting through four years of lows.
But it’s Russia that currently worries me the most — both for the sake of its own people and the rest of the world.
If Russia’s economic swan dive could be blamed exclusively on its showdown with the West — sanctions, countersanctions and now more sanctions — you could argue that, once politicians on both sides come to their senses, a big rally might be in the offing.
Alternatively, if you could pin it all on the oil-price slump, you might argue that, as soon as oil markets turn, all would be fine.
The reality, however, is that Russia is being dragged down by both of these simultaneously. And both are entrenched megatrends with no signs of ending: The anti-West propaganda machine in Russia is now fully entrenched and empowered, making it almost impossible politically for the leadership to reverse course. And even if oil markets started recovering today, it could take years for Russia to recoup lost revenues.
Bottom-line: Russia is trapped in a Great Recession that’s probably going to be a lot bigger than what the U.S. has seen in recent years. They’re looking at …
* GDP set to shrink by 3.4% this year and by as much as 9% overall
* A ruble that sank by half last year, and is now sinking again.
 * Plus a great bear market in Russia’s leading stocks, which, even in the absence of an East-West conflict, would frighten away the most cold-blooded global investor.
Like Brazil’s stock market, it’s not too far from the prior Big Bottom made in early 2009.
And like Brazil’s, if that critical low is breached, a further collapse could be hard to avoid.
The big question …
What does this mean for U.S. investors?
Are these foreign markets strictly victims of the global flight to quality — hitting their stocks hard, but giving ours a boost?
Or are they early storm warnings of similar tempests that could ultimately reach the United States too?
We believe that, for now at least, it’s mostly the former. But it’s not too soon to start waving a yellow flag of caution.
So if you haven’t done so already, be sure to …
 Own only the highest-quality stocks in the strongest U.S. sectors …
Keep a super-sized portion of your money in cash, and
Get ready to take even more protective action if needed.
Good luck and God bless!
Martin

When you attend the funeral of a dearly departed friend or relative it is appropriate to show due respect by wearing black. Similarly, in this update on the Tech Sector, which will very soon be on its deathbed, it is appropriate that we show due propriety and respect for the seriousness of the situation by presenting our analysis on somber black charts.
Some investors may have been fooled into thinking that because the NASDAQ Composite index, whose 1-year chart is shown below, is still in an uptrend and recently made new highs, that all is well with the sector, especially as it is outperforming the broad market S&P500 index which has been treading water all this year in a tight range, as shown on its 1-year chart a little further down the page, but as we will see on the long-term charts, all is not well at all, and both these indices are now set up to drop hard or crash.


We have already looked at the giant bearish Rising Wedge that is completing on the long-term chart for the S&P500 index in the article PREPARING FOR THE CRASH – S&P500 Index Analysis that was posted on the site on 31st July, and we need only observe here that it is already at the point of breaking down from this Wedge, a development that is expected to lead to a precipitous decline.

Now, I am sure most readers would agree that it is hardly likely that the S&P500 index should drop hard or crash, and the Tech Sector, as represented by the NASDAQ index, escape unscathed – on the contrary we would expect it to crash too, especially as it is another bubble, and a big one at that. Thus it should come as no surprise that the NASDAQ Composite Index is completing a giant bearish Rising Wedge pattern that parallels the one completing in the S&P500 index, as we can see on its long-term chart below. What this implies is that when the S&P500 index breaks down into a severe decline, the NASDAQ Comp is going to do likewise, and this being so, it behoves us to short (buy Puts) in the weakest stocks in the sector in advance of such a breakdown.

While on clivemaund.com we would never stoop to indulging in black humor, particularly when it involves a subject as serious as this, I can assure you that we are going to have one helluva “Wake” if what is expected to happen comes to pass. That’s because we are going to be short the market in a big way using bear ETFs and Puts, and a range of suitable inverse ETFs has already been described on the site.
On a lighter note, if any of you want to print this out, and avoid the waste of ink involved with printing black charts, I can make a version with light colored charts, just let me know. Please note, however, that lighter colored charts will not alter the gloomy outlook for the market.

3 Warnings For Bulls – Oversold Bounce Likely….
Well…after months and months of indigestion, the markets MAY, and I repeat MAY, have finally come to a decision to end the current bull market run.
The reason I say MAY, and not definitely, is that we have seen initial breaks of trends previously (red circles in the chart below) that were quickly resolved by rapid Federal Reserve interventions.
Also, as I have repeatedly stated in the past, by the time that a major “sell signal” is in place the markets are always extremely oversold on a short-term basis. That oversold condition gives investors an opportunity to safely exit the markets on a bounce to previous resistance. Such was clearly evident, to those paying attention at the peak of the last two bull markets.

The chart above makes an important distinction between “PORTFOLIO MANAGEMENT” and “MARKET TIMING.”
Market timing is trying to be “ALL IN” or “ALL OUT” of the market at a specific point in time, preferably tying to hit the exact top and exact bottom of the market. While an individual may get lucky at one point, it is nearly impossible to replicate such timing on a consistent basis. The eventual, and inevitable, miss of a turning point can be a costly investment mistake.
However, portfolio management is simply the process of recognizing that market dynamics have changed and either increasing or reducing the exposure to “risk” related investments accordingly. As shown in the chart above, investors following the “signals” would have NOT sold at the top or bought at the bottom. However, they would have gracefully exited the markets and missed a bulk of the destruction of capital during the last two bear markets and would have garnered a vast majority of the subsequent gains.
This is a fine point lost by the always bullish media. Those who promote “buy and hold” allocation models are simply being “lazy,” or they are not knowledgeable, with respect to the actual practice of portfolio management. This should also elicit the question of exactly what you are paying a fee for?
However, I digress.
Oversold Bounce Likely
As I stated above, by the time the market triggers a “sell” signal, the negative price action has generally exhausted sellers in the short-term.
This is an important point. There is an old adage that says:
“For every buyer, there is a seller.”
This is true – BUT while there is a buyer for every seller, which is required to complete a transaction, it is atWHAT PRICE that counts.
Think about it this way, if a transaction ALWAYS occurred at a given market price, there would be NO price volatility in the market. However, when there are a large number of people willing to sell at “X” price, but only a limited number of people willing to buy at “Y” price, sellers must drop their price to find buyers. At some point, the number of people willing to sell at a given price will become exhausted, and there will be more buyers which will begin to move prices higher.
This is why paying attention to “overbought/oversold” indications can help identify when this potential “exhaustion” phase has occurred.
What the chart below shows is that currently the markets have once again become oversold which sets the market up for a short-term bounce.

However, as highlighted in yellow, the previous “bullish” consolidation has now been reversed into a potential “bearish” trend. With deteriorating relative strength and a lack of real conviction in the markets, the easiest trend for prices currently is downward.
The following chart is a WEEKLY chart which shows the continuation of the markets to fail at the current downtrend resistance. Three failed breakout attempts, and a close below the long-term bullish trend support moving average (black dashed line) all suggest the market will likely retest the 2000 level in the near future. If that 2000 level support is taken out, I have identified further correction levels back to the October 2014 lows. However, a correction of that magnitude will have completely changed the complexion of the market overall.

3 Warnings For Market Bulls
I HIGHLY suggest you read Thursday’s post “3 Warnings For Market Bulls.” However, for those that want the “Cliff Notes” version, here you go:
Lowry Sees Bull Market Ending
There is a very interesting podcast at Financial Sense with Richard Dickson, who is the Senior Market Strategist at Lowry Research.
Dickson says when the broader indexes are approaching a top, the advance is led by fewer and fewer stocks, which has been seen at every major market peak they’ve studied.
This phenomenon registers in the market’s widely followed advance-decline line, however, Dickson points out that relative under-performance by small-cap stocks often provides an earlier warning signal to potential trouble ahead. He notes that small-cap stocks began to deteriorate almost a year ago, and many have already entered bear market territory. This is not healthy action, he says.
Based on research conducted at Lowry, this predicts a market top within 4 to 6 months. In the interim, Dickson will be watching a variety of other technical indicators for confirmation, such as buying power and selling pressure.
Here is a chart of the advance-decline line and small-cap performance relative to the S&P 500.

McClellan: Market Lacking “Escape Velocity”
Tom McClellan, a family famous for the “McClellan Oscillator” recently issued a note discussing the importance of the number of advancing and declining issues and “escape velocity.” To wit:
“To understand this important point, we need to explore and define a principle of rocketry known as ‘escape velocity.’ This term is variously (and sometimes confusingly) defined as the velocity which a projectile needs in order to escape the gravitational field of a planet or other body, and/or the velocity needed to achieve stable orbit as opposed to falling back down to Earth. My purpose here is not to defend either definition; for our purposes, the idea is the same, that there needs to be sufficient energy to keep from falling back down.
The Summation Index can show us that. For this discussion I will be using the Ratio-Adjusted Summation Index (RASI), which factors out changes in the number of issues traded.,,the RASI gives comparable amplitude levels with which to evaluate available financial market liquidity.“

“The +500 level for the RASI is the important go/no-go threshold for this concept of ‘escape velocity.’
Since the 2009 bottom, the Federal Reserve has made sure that there was liquidity available to the financial markets, at least for the most part. The cutoffs of liquidity after both QE1 and QE2 led to vacuums in the banking system, and stock prices fell into those vacuums. The question for 2015 is whether Fed actions are going to take away the liquidity punch bowl, and create a problem for the next rally’s ability to achieve escape velocity.
We saw this principle of diminished liquidity back in 1998-2000, and again in 2007-08, as highlighted in this historical chart. When the RASI failed to climb back up above +500, it said that there were liquidity problems which ended up keeping the stock market from being able to continue itself higher.”

“My leading indication from the eurodollar COT data says that we should expect a major top in August 2015, and so there is not all that much time left for the RASI to get back up above +500. An upturn from this oversold condition should be able to produce a marginally higher price high, but if it cannot produce a RASI reading above +500, then we will know that the end has arrived for the bull market.”
Effron: M&A Activity Looks A Lot Like 2007
In a recent interview on CNBC, Blair Effron, co-founder of Centerview Partners and one of Wall Street’s biggest dealmakers, highlighted the similarities between the current M&A environment to that of 2007.
Currently, M&A activity is at its highest level since 2007 with global volumes hitting $2.9 Trillion since the beginning of 2015. According to data from Dealogic, that is a surge of 38% as compared to the same period in 2014.
Importantly, Effron also notes that the high valuations paid for M&A deals are, in large part, being driven by the current low interest rate environment.
Of course, with low interest rates, that means the majority of those deals are being funded by debt issuance. via WSJ:
“According to Dealogic, the Americas accounts for 83% of global acquisition related bonds, with a record $241.7 billion issued so far this year, compared with just $62.6 billion this time last year. In Europe, 38% of all high-yield bond issuance in the first half of the year has been related to M&A activity, according to Credit Suisse.”

That is an interesting point since that is the same argument for high stock valuations, stock buy backs and dividend issuance and the housing market. Given that the vast majority of analysts currently believe interest rates are on the verge of rising, logic would suggest that such will likely be a negative for the bullish mantra.
While we have seen this same game play out repeatedly before, this time is surely different…right?
It’s time to pay attention boys and girls – I have a sneaky suspicion things are about to get very interesting.
Have a great weekend

Lance Roberts
Important Notice:
Lance Roberts is a General Partner of STA Wealth Management. He is also the host of “Street Talk with Lance Roberts”, Chief Editor of “The X-Factor” Investment Newsletter and author of “The Daily Exchange” blog Follow Lance on Facebook, Twitter and Linked-InI have started a NEW regular feature on the website. Every TUESDAY, I will be posting a technical market update to capture any changes to the strategy that may have occurred between Friday’s close and Monday’s open.
Be sure and subscribe to my social media feed to be notified of updates as they are posted.
Facebook, Linked-In or Twitter

 The New Normal?
Regulatory Capture
Blame Flows Downhill
A Hopeful Note
Starving for R&D
Quarterly Mindset
Fishing for a Candidate
“Bureaucracy destroys initiative. There is little that bureaucrats hate more than innovation, especially innovation that produces better results than the old routines. Improvements always make those at the top of the heap look inept. Who enjoys appearing inept?”
– Frank Herbert, Heretics of Dune
“Economies naturally grow. People innovate as they go through life. They also look around at what others are doing and adopt better practices or tools. They invest, accumulating financial, human and physical capital.
Something is deeply wrong if an economy is not growing, because it means these natural processes are impeded. That is why around the world, since the Dark Ages, lack of growth has been a signal of political oppression or instability. Absent such sickness, growth occurs.”
– Adam Posen, “Debate: The Case for Slower Growth”
Today’s letter will be shorter than usual, because I’m at Camp Kotok in Grand Lake Stream, Maine, where the first order of business today is trying to outfish my son (not likely to happen, this year). But I’ve been looking closer at productivity barriers, and I want to give you some points to ponder.
Like many of you readers, I’m old enough to remember a time when 2.3% annual GDP growth was a disappointment. We always knew America could do better. Not anymore, apparently.
Some people actually cheered last week’s first estimate for 2Q real GDP growth. It was 4.4% in nominal terms, but inflation brought the figure back down. While certain segments are growing like crazy, for the most part we are muddling along in a slow-growing malaise. You might even call it “stagnant.”
I for one still think the United States can do more. We have a large population of intelligent people who want to build a solid future for their children. They’re willing to work hard to do it. If that’s not happening – and clearly it isn’t – some barrier must be standing in their way.
What is this barrier to productivity and growth? There are actually several, but government red tape is one of the biggest. I thought about this after reading an excellent Holman Jenkins column in the Wall Street Journal last week.
Jenkins led me to an audio recording of an interesting discussion on “The Future of Freedom, Democracy and Prosperity,” conducted at a symposium held at Stanford University’s Hoover Institution last month.
Government research & development funding has fallen off considerably from its peak in the 1970s moonshot days. This holds back worker productivity. The federal government is doing too much to slow down business and not enough to boost it.
The three economists who spoke at Stanford all pointed to important productivity barriers emanating from Washington DC.
One of the participants, Hoover economist John Cochrane, spoke of fears that America is drifting toward a “corporatist system” with diminished political freedom. Are rules knowable in advance so businesses can avoid becoming targets of enforcement actions? Is there a meaningful appeals process? Are permissions received in a timely fashion, or can bureaucrats arbitrarily decide your case by simply sitting on it?
The answer to these questions increasingly is “no.” Whatever the merits of 1,231 individual waivers issued under ObamaCare, a law implemented largely through waivers and exemptions is not law-like. In such a system, where even hairdressers and tour guides are subjected to arbitrary licensing requirements, all the advantages accrue to established, politically connected businesses.
The resources that businesses put into complying with government regulations is staggering. I have often envied people outside the highly regulated financial industry for their freedom to operate rationally. In my business we seem to spend half our time – and an ungodly fraction of our money – just maneuvering through the regulatory morass.
Intrusive federal regulations touch every part of the economy:
- Energy and mining companies have to deal with environmental protection rules.
- Drug companies and health care providers must satisfy the FDA and Medicare.
- Cloud technology companies have to process FBI and NSA demands for user information.
- Retailers and consumer product makers are required to abide by the fine print on millions of product labels.
I could go on, but you get the point. Anything you do attracts bureaucratic oversight now. We may laugh at “helicopter parents” hovering over their children at school, but we all have a helicopter government looking over our shoulders at work.
Before anyone calls me an anarchist, I think some government regulation is perfectly appropriate. We all want clean drinking water. Everyone appreciates knowing our cars meet crash survival standards. I’m glad FAA is keeping order in the skies.
The problem arises when agencies enforce confusing, contradictory, and excessive regulations and try to micromanage the nation’s businesses. Every business owner I know is glad to play by the rules. They just want to know what the rules say, and that is frequently very hard to do.
A few weeks ago, in “Productivity and Modern-Day Horse Manure,” I explained that growth is really quite simple: if we want GDP to grow, we need some combination of population growth and productivity growth.
The US population is growing, thanks mainly to immigration, but the effectiveness of the workforce is another matter. Baby Boomer retirements are rapidly removing productive assets from the economy. To offset that trend, we need to make younger workers more productive.The red tape that constantly spews out of Foggy Bottom is not helping matters.
The red tape hurts the economy overall, but it does help certain parties. The largest players in any niche often “capture” their regulators. Then they use their influence to tilt enforcement away from themselves and toward smaller competitors.
Put simply, new regulations can be great for your business if you are already well established and have the resources to comply with government mandates. New entrants rarely have those resources. The resulting lack of competition boosts profits for the big players but hurts consumers. The competition that would normally lead to better, less-expensive goods and services never happens.
Holman Jenkins makes another great point about how overregulation affects growth.
Another participant, Lee Ohanian, a UCLA economist affiliated with Hoover, drew the connection between the regulatory state and today’s depressed growth in labor productivity. From a long-term average of 2.5% a year, the rate has dropped to 0.7% in the current recovery. Labor productivity is what allows rising incomes. A related factor is a decline in business start-ups. New businesses are the ones that bring new techniques to bear and create new jobs. Big, established companies, in contrast, tend to be net job-shrinkers over time.
Recall our economic growth formula: population growth plus productivity growth. The US population grew at a peak rate of 1.4% in 1992, and growth has been trending down ever since. Now it is around 0.75% per year. Add that to 0.7% productivity growth, and you see why Jeb Bush’s 4% growth target will be so hard to hit.
Business leaders love to complain about the bureaucrats who run Washington’s alphabet-soup agencies. I think the problem goes deeper.
With only a few exceptions, the regulators I’ve met over the years have been competent professionals. They weren’t intentionally trying to hurt my business. Often the regulations confused them as much as they confused me.
The real blame, I think, starts on Capitol Hill. Our legislative process is a sausage factory. Congress passes vague, complicated laws riddled with exceptions for this and zero tolerance for that. The result is superficially attractive but a mess inside. People in the alphabet agencies then have to remove the sausage skin and make sense of the contents. This would be a tough job for anyone. I certainly don’t envy them.
Jenkins mentions Obamacare’s convoluted waivers and exemptions. Even its advocates admit the law is a crazy mess. But how and why did it get that way?
Like most major programs, the Obamacare law is a giant collection of compromises and favors.
All these provisions were necessary to make Obamacare palatable to various and sundry legislators and the interest groups whose pockets they’re in. Quite literally no one wanted what the process created. The left wing wanted a public option, or “Medicare for everyone.” The right wing wanted tax credits and across-state-line insurance sales. Nobody wanted the bloated, half-rotten sausage of a law we have now.
The much-hated individual mandate, for instance, wasn’t part of the original plan. Healthcare reform was a big issue in the 2008 Democratic primary. Hillary Clinton insisted everyone should have to buy insurance. Barack Obama opposed a mandate for adults and wanted it only for children. They argued about this several times in their early debates.
Obama was elected and then didn’t deliver on his preferred option. He changed course and accepted the individual mandate. He may have had no choice – forcing healthy people into the pool was the only way insurers would agree to cover preexisting conditions.
Once the law passed, the IRS then had to enforce the individual mandate and identify who deserved tax credits and how much they should get. They did it the only way they could: by making our tax returns even more complicated than they already were.
That’s only one law. Multiply this by hundreds of similarly convoluted strings of sausage that have emitted from the Congress in recent decades. We can laugh about China’s economic central planning, but here in the US we have the opposite of central planning: our form of government delivers an inefficient, uncoordinated mess.
This isn’t simply wasteful and expensive. Businesses expend precious productive resources trying to follow crazy, conflicting rules. And big companies use regulations to stifle smaller competitors.
All this unproductive effort makes the economy less likely to innovate, grow, and create new jobs. We see the results in persistently low employment, wages, and GDP growth.
Holman Jenkins correctly points out that this mess is the fault of both political parties.
Tea party types talk a good game, but many are dependent on an unreformed Social Security and Medicare, and lately some have rallied to Donald Trump, who distracts them by blaming immigrants without actually offering a solution to immigration or consecutive sentences on any policy question. Meanwhile, the Barack Obama–Hillary Clinton Democratic Party offers bigger, more intrusive government as the solution to the problems of traditional minorities, the economically insecure, and target blocs like single women or the LGBT community.
Electing the right president or the right Congress isn’t going to fix this. Either party will always do whatever its donor class demands. We might get a slightly different set of problems, but they will be no less problematic for the economy.
Jenkins wraps up on a hopeful note, though. How, he wonders, did the Carter and Reagan administrations manage to deregulate energy and transportation? Voters weren’t demanding those changes, and plenty of big players opposed both moves. Yet uber-liberal Ted Kennedy led a fight that decontrolled airline fares. What was going on back then?
If we can figure that out, and make it happen again, we might be able to close the Congressional sausage factory. Unfortunately, that isn’t the only big problem on Capitol Hill.
We’ve established that government regulations stifle economic growth. That’s bad enough, but Congress compounds the problem by authorizing too little of the kind of government spending that helps growth.
Government spending helps growth? I know that statement is heresy to some. I, too, would prefer to have government stay completely out of private affairs. In the real world, however, many useful technologies had their origins in federal programs: nuclear power, jet engines, satellites, microchips, the Internet, GPS, and more.
Would the private sector have produced these? That’s a counterfactual speculation that no one can prove or disprove. We do know that government research that depended on support from agencies like the National Institutes for Health (NIH) and the Defense Advanced Research Projects Agency (DARPA) helped drive innovation in the economy. Do we need more of it?
We used to have quite a bit more of it. Expressed as a percentage of GDP, government R&D spending peaked with NASA’s Apollo space program in the late 1960sand early 1970s. It got a little bump from defense spending in the Reagan years and the Human Genome Project launched toward the end of Bill Clinton’s era, but the overall trend is still down.

Source: http://www.bloomberg.com/news/articles/2015-06-04/look-who-s-driving-r-d-now
At the same time, private-sector R&D grew steadily before retreating in the early 2000s. From there it grew at a more moderate pace as businesses spent cash on stock buybacks and higher dividends. Now it’s jumping even more – I think because businesses recognize the need to boost productivity.
Writing for Bloomberg Businessweek in June of this year, Matthew Philips and Peter Coy found this private investment might be just the ticket to boost economic growth.
Companies have been pouring money into research and development at the fastest pace in 50 years. From November through the end of March, U.S. companies funded R&D at an annual rate of $316 billion, or about 1.8 percent of gross domestic product, the largest share ever for the private sector. That’s up from 1.7 percent last year and 1.6 percent from 2007 to 2014. “If secular stagnation is a ‘thing,’ then U.S. companies are investing like crazy to make sure it doesn’t happen,” says Neil Dutta, senior U.S. economist at Renaissance Macro Research.
After years of spending cash on dividend boosts and share buybacks, U.S. companies may finally be realizing they need to start seeding real innovation. To some economists, this marks a turning point as companies make the transition from engineering short-term profits to devising products and more efficient methods of doing business. “In a way, this is what we’ve been waiting for,” says Torsten Slok, chief international economist at Deutsche Bank. “It’s not quite Godot arriving, but it’s close.”
They go on to say this shift is not a sure thing. The time lag between conducting R&D and selling actual products can be years, even decades. And the government labs that hatched big ideas now hatch them more slowly and they don’t move into the private sector as quickly.
Looking at the chart above, economic growth seems to coincide with periods when both private (blue line) and government (red line) R&D spending rose together.
Right now only the blue line points higher. Will federal R&D spending return to growth? Frankly, I don’t see how. No matter how next year’s election turns out, the White House and Congress will have to sustain rising entitlement and military spending with little or no additional revenue. They won’t have much slack, and I doubt they will want to expand projects whose payoff is years in the future (or possibly never).
That means private industry will have to pick up the slack. Can it?
Some US corporations get this. At Facebook, for example, CEO Mark Zuckerberg told shareholders last year not to expect profit growth because the company would make huge investments in new products. He wasn’t kidding.
Companies like Facebook are the exception. Most CEOs give in to shareholder demands for expanded stock buyback programs or higher dividends. This is perfectly logical from these executives’ personal viewpoints: most of their compensation comes from stock options. Share buybacks are what keep that gravy train moving without diluting other shareholders.
Jerry Grantham took the “stock option culture” to task in his most recent quarterly investment letter:
This near-perfect synergy between Fed policy and the stock option culture has, not surprisingly, resulted in most of the corporate cash flow of public companies being used for stock buybacks – a record $700 billion annualized rate this year at the expense of corporate investments in expansion. Thus, well into the seventh year of economic expansion, we have uniquely had no hint of a surge in capital spending, which remains well below average. And why should we be surprised? For how risky it is to build new factories and shake them down in a world where things can go wrong and corporate raiders lurk. How safe it is to buy your own stock [and how easy to raise debt with which to do so, given the wondrous workings of QE-SLF] and how likely that doing so will push prices higher, thus increasing option values (making it easier for CEOs to go from earning 40 times the average worker in 1965 to over 300 times today) and enlarging the Fed’s wealth effect at the same time!
But the downside is less corporate expansion; less GDP growth; lower job creation, and hence lower wages. Pretty soon, Mr. Ford, there will be no one to buy your cars. The economy becomes persistently disappointing for yet one more reason.
Source: http://online.barrons.com/articles/jeremy-grantham-the-10-topics-that-really-matter-1438122157
Sadly, we seem to be at a point where the mindset in the nation’s C-suites is not so different from the mindset on Capitol Hill. Our politicians think ahead no further than the next election, while our business executives think only of the next quarterly and annual reports.
If short-term thinking continues to rule both the public and private sectors, we are going to stay stuck in the mud. The outcome, as Jeremy Grantham says, will be “less corporate expansion; less GDP growth; lower job creation, and hence lower wages.”
A quote came to mind which I believe is attributed to Henry Ford: “If you keep doing what you’ve always done, you’ll keep getting what you’ve always got.”
What we’re doing right now is working well enough to keep the US out of recession. We’re also seeing some mild improvement in employment and consumer spending. If we stay on the present course, we’ll keep getting mild improvement.
The problem is that we’re in a tunnel with a giant debt train chasing us from behind. Doing what we’ve always done will eventually get us run over. Somehow, we have to start running faster.
Last night I watched the first Republican primary debate along with much of the group. Our group here at Camp Kotok in Grand Lake Stream, Maine, is very diverse in terms of the political spectrum, so that made for fun watching. Rather than talking about who won and lost, let me offer another thought. The big winner was the process. To everyone’s surprise (and certainly if you had asked a year ago), the TV audience was huge. Eight times more people watched than tuned in for the last presidential cycle’s first debate. It was the largest cable audience ever for a non-sports event.
Who knew the Republican primary could be a reality show? Sadly, it took The Donald to make that happen, but it is worth suffering through his bloviating to get the audience to listen. What they heard were 4-5 very good potential candidates, although there was some vigorous disagreement in the room here over who made up the top four. I bet you and I might have a different list as well.
That is beside the point. The Republican primary is now Survivor. People will start watching to see who gets voted off the island. I bet this even boosts the ratings for the Dems. Maybe they could get George Clooney to run and then beat the GOP numbers. Just saying.
Your hoping we can learn to make better sausage analyst,

John Mauldin
subscribers@MauldinEconomics.com
 Earlier this year we witnessed a sharp uptick in a number of the energy related stocks in our Coverage Universe from the lows experienced after the oil price shock which began this past fall. The spike began in early March as oil prices strengthened and investors bid up depressed energy shares, particularly in some of the quality names we cover(ed). As the adage states however, even a dead cat will bounce if you drop it from sufficient heights. We worried that oil was the bouncing cat.
By May, a number of producers and oil service stocks had more than doubled since dropping to year lows in January of this year. While some of the gains were deserved as the price declines are typically over done when panic sets in, in our Focus Buy Quarterly Commentary at the time, we saw risk in the segment as capital spending has ground to a halt in some areas. At that time crude was well above its lows but still remained 35-40% lower than the levels we saw at this time last year and by most reports, the world remained rather awash in oil.
Given this widely held view, it was unclear as to whether a continued uptick in oil is sustainable. What we did and continue to know is that capital spending will be significantly lower in the energy segment for at least 12-months time. As such, recommended not to add to our exposure in this group and took the opportunity to cut some names following the recent uptick as almost all energy related companies continue to face significantly lower year-over year results for the next 12-18 months minimum.
Fast forward to today as both WTI and Brent Oil are hitting new-year lows, we continue to advise clients to avoid all but one or two energy names in our Small-Cap Coverage Universe near term. Poor year-over-year cash flow comparisons will continue for at least the next 3-4 quarters and with share prices hitting new-year lows, we expect the sector to be a favourite in this year’s late November and early December tax loss selling.
As such, we do not believe now is the time to begin buying energy related stocks. While our analysts will re-evaluate the landscape at the time, we expect to see some value in this segment near the end of 2015. This does not guarantee we will be buyers however, as we look for both value or reasonable prices and growth. The latter may not present itself again for quite some time.
Broader Markets
Broader North American markets remain fixated on the U.S. Federal Reserve.
Canada’s main stock index fell on Friday in a broad retreat led by heavyweight energy and financial stocks as oil prices recorded their sixth straight weekly loss and North American jobs data highlighted Canada’s relatively flaccid economy.
Canadian employment data showed a small gain in June, but a loss of full-time positions, while U.S. numbers were close enough to forecast to stoke bets the Fed will raise interest rates, perhaps as early as September.
In the U.S., investors have been negatively reacting to positive economic news, as it increases the likelihood of a rate hike in September.
Historically, investors have a wide variety of investment options. Many believe the low rate environment has made stocks the only game in town. Raising rates puts a crimp in this.
The theory is that when comparing the average dividend yield on a blue-chip stock to the interest rate on a certificate of deposit (CD) or the yield on a U.S. Treasury bond (T-bonds), investors will often choose the option that provides the highest rate of return – on a risk adjusted basis. With rate held to zero, stocks have been the preferred vehicle. The current federal funds rate tends to determine how investors will invest their money, as the returns on both CDs and T-bonds are affected by this rate.
Rising or falling interest rates also affects consumer and business psychology. When interest rates are rising, both businesses and consumers will cut back on spending. This can cause earnings to fall and stock prices to drop. On the other hand, when interest rates have fallen significantly, consumers and businesses will increase spending, causing stock prices to rise.
As we get closer to September, the data reports will be more and more important, and July’s U.S. job data was consistent with the trend the Fed wants to see before they decide to pull the trigger on the first rate hike. Many believe the market is now putting a greater probability on the Fed raising rates in September. However, today’s number was spot on consensus, and it’s not really spectacular enough to make a September rate hike a foregone conclusion.
All eyes will be on August data, and unless there is a surprise to the downside, a September hike seems increasingly probable.
|
KeyStone’s Latest Reports Section 7/9/2015 |
Disclaimer | ©2015 KeyStone Financial Publishing Corp.


-
I know Mike is a very solid investor and respect his opinions very much. So if he says pay attention to this or that - I will.
~ Dale G.
-
I've started managing my own investments so view Michael's site as a one-stop shop from which to get information and perspectives.
~ Dave E.
-
Michael offers easy reading, honest, common sense information that anyone can use in a practical manner.
~ der_al.
-
A sane voice in a scrambled investment world.
~ Ed R.
Inside Edge Pro Contributors

Greg Weldon

Josef Schachter

Tyler Bollhorn

Ryan Irvine

Paul Beattie

Martin Straith

Patrick Ceresna

Mark Leibovit

James Thorne

Victor Adair