
Gold & Precious Metals
The precious metals complex has attempted to stabilize over the past few weeks. Some markets have had more success than others. Gold has been able to hold $1080/oz while GDXJ has also held its recent low. The large cap indices (GDX, XAU, HUI) have grinded lower to new bear market lows this week. This leads us to the near term predicament. Is the sector basing before a rebound or merely consolidating before another steep leg down?
Gold will certainly give us the answer and it could come within a few days. While Gold has held support at $1080/oz it has yet to break above $1100/oz. A daily close above $1100/oz would likely lead to $1140/oz whereas a daily close below $1080/oz could lead to a decline down to major support around $1000/oz. We should note that the current net speculative position in Gold is the lowest in 14 years at 3.4% of open interest or ~15K contracts. I would not be surprised to see speculators eventually become net short Gold.

Gold & Gold CoT
Gold is not quite as oversold as the gold miners which have been beaten and bludgeoned to death. GDXJ and GDX, charted below, show black candles in each of the past seven weeks and in GDX’s case eleven of the past twelve weeks. The miners are extremely oversold based on any and every metric and period. Note the price action over the past few weeks. The miners have failed to rally but have not closed near the lows of the week. That suggests waning selling pressure or accumulation. A rebound could begin at any moment.
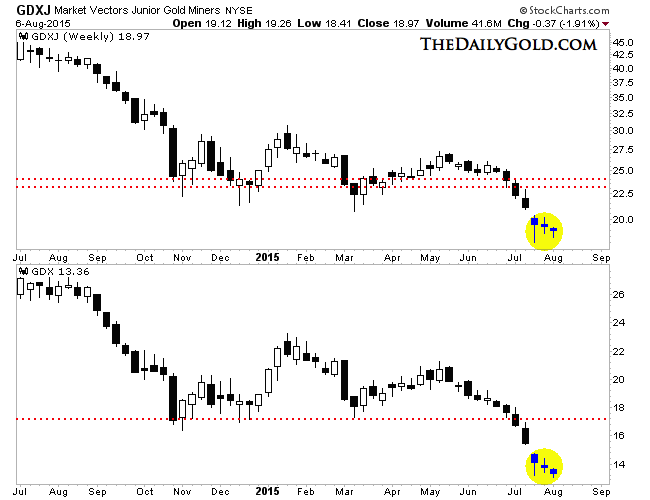
GDXJ & GDX
It would be quite interesting to see what happens to the miners if Gold were to break below $1080/oz and decline towards $1000/oz. Given that the miners are already extremely oversold (and in their worst bear market ever), it is quite possible they begin to rebound before Gold reaches support at $1000/oz. In addition, if this is the way Gold breaks (lower rather than higher) then it is also quite possible that the bear market ends after that decline. That would be sooner than everyone expects.
The near term remains uncertain but we could get clarity on Friday. In any case, the precious metals sector is due for a rebound. Failure to rebound in the days ahead tells us that we could ultimately see an even greater and more significant rebound from lower levels. As we navigate the end of this bear market,consider learning more about our premium service including our favorite junior miners which we expect to outperform in the second half of 2015.
Jordan Roy-Byrne, CMT


 …..Devalues Yuan by Record Amount, Vows to “Severely Punish” Capital Flight
Tuesday morning, the People’s Bank of China pulled the ripcord.
In a big way…..read more HERE

Stocks bounced higher on Monday, fuelled by strength in markets overseas, as well as takeover news in the US. Major benchmarks in the US closed higher by over 1%, the largest one-day jump since May. The S&P 500 Index bounced firmly from its 200-day moving average, yet again, emphasizing the significant support that exists at this long-term average. Since the start of July, the large-cap index has recorded three major tests of this average, making it vulnerable to breakdown as the weight of the benchmark leans on support. The percent of stocks in the index above 200-day moving averages currently sits at 57%, down from 90% recorded last summer; market breadth continues to wane. As an increasing number of stocks break below their 200-day moving averages, the weight on the broader market will become apparent, turning what was previously support into resistance. For now, support cannot be denied, a trend that will continue until it ends. However, should a break occur at this long-term average, the losses are likely to continue over the short to intermediate-term.

Sentiment on Monday, as gauged by the put-call ratio, ended overly bullish at 0.56. Monday’s closing put-call ratio matches the lowest level of the year, last charted on May 11. Typically, when investors lean bullish to the degree that the ratio is suggesting, equity market losses typically follow.

….for the comprehensive daily report including seasonality and sentiment click on any chart above or go HERE
Available Mon- Friday after 6:00 P.M. Eastern, 3:00 Pacific.
“In spite of some misgivings, we are going to change our posture on some markets. See below.”
DOW + 242 on 1600 net advances
NASDAQ COMP + 58 on 1050 net advances
SHORT TERM TREND Bullish
INTERMEDIATE TERM TREND Bullish
STOCKS: We had an oversold market at the opening of the session and the following happened. There was some merger activity that caused an upmove in the market. Greek banks received some funding. China’s market was up almost 5% and finally, over the weekend, Barron’s recommended the buying of commodities, specifically gold and crude oil. The latter obviously helped gold and oil shares.
On the other hand, volume was very low, which indicated short covering instead of serious accumulation. Also, the calendar from now into October is historically weak.
In spite of some misgivings, we are going to change our posture on some markets. See below.
GOLD: Gold rose $10. This was probably helped by the aforementioned article in Barron’s.
NEXT DAY: Tuesday — No prediction
CHART: Five day RSI for the S&P 500 curled up from an oversold condition. This normally results in further strength.

BOTTOM LINE: (Trading)
Our intermediate term system is on a buy. No intermediate term positions for now.
System 7 We bought the SSO at 67.27. Hold on Tuesday. It’s
disappointing that we had to pay up so much, but we should make money here.
System 8 We are in cash. Stay there.
GOLD We are in cash. Stay there.
News and fundamentals: There were no important economic releases on Monday and there won’t be any on Tuesday.
Interesting Stuff “The superior man blames himself. The inferior man blames others” ———Don Shula
TORONTO EXCHAN GE: Toronto was up 164.
S&P/TSX VENTURE COMP: The TSX was higher by 6.
BONDS: Bonds fell back.
THE REST: The dollar dropped again. Silver and crude oil were higher.
We’re on a buy for bonds as of June 11.
We’re on a sell for the dollar and a buy for the euro as of July 21.
We’re moving back to a buy on gold as of today August 10.
We’re moving back to a buy on silver as of today August 10.
We’re on a sell for crude oil as of July 16.
We’re on a sell for the Toronto Stock Exchange as of May 6.
We’re on a sell for the S&P\TSX Venture Fund as of October 30, 2014.
We are on a long term buy signal for the markets of the U.S., Canada, Britain, Germany and France.

INDICATOR PARAMETERS
Monetary conditions (+2 means the Fed is actively dropping rates; +1 means a bias toward easing. 0 means neutral, -1 means a bias toward tightening, -2 means actively raising rates). RSI (30 or below is oversold, 80 or above is overbought). McClellan Oscillator ( minus 100 is oversold. Plus 100 is overbought). Composite Gauge (5 or below is negative, 13 or above is positive). Composite Gauge five day m.a. (8.0 or below is overbought. 13.0 or above is oversold). CBOE Put Call Ratio ( .80 or below is a negative. 1.00 or above is a positive). Volatility Index, VIX (low teens bearish, high twenties bullish), VIX % single day change. + 5 or greater bullish. -5 or less, bearish. VIX % change 5 day m.a. +3.0 or above bullish, -3.0 or below, bearish. Advances minus declines three day m.a.( +500 is bearish. – 500 is bullish). Supply Demand 5 day m.a. (.45 or below is a positive. .80 or above is a negative). Trading Index (TRIN) 1.40 or above bullish. No level for bearish.
No guarantees are made. Traders can and do lose money. The publisher may take positions in recommended securities.

-
I know Mike is a very solid investor and respect his opinions very much. So if he says pay attention to this or that - I will.
~ Dale G.
-
I've started managing my own investments so view Michael's site as a one-stop shop from which to get information and perspectives.
~ Dave E.
-
Michael offers easy reading, honest, common sense information that anyone can use in a practical manner.
~ der_al.
-
A sane voice in a scrambled investment world.
~ Ed R.
Inside Edge Pro Contributors

Greg Weldon

Josef Schachter

Tyler Bollhorn

Ryan Irvine

Paul Beattie

Martin Straith

Patrick Ceresna

Mark Leibovit

James Thorne

Victor Adair