
Energy & Commodities
Trading position (short-term; our opinion): No positions are justified from the risk/reward perspective.
Although crude oil climbed above $43.50 on Friday, the combination of a stronger greenback and the Baker Hughes report pushed the commodity lower. As a result, light crude gained 1.28%, but closed the day below important resistance zone. What’s next?
Friday’s data showed that U.S. producer prices were higher for a third straight month in July and factory output increased at the fastest rate in eight months, which supported the greenback and made crude oil less attractive to users of other currencies. Additionally, Baker Hughes reported that U.S. oil rigs increased by two to 672 last week for the week ending on August 7, marking the fourth straight week of weekly builds. In these circumstances, light crude gave up some gains, but closed the day above the March low, invalidating earlier breakdown. Will we see higher values of the commodity in the coming week? (charts courtesy of http://stockcharts.com).

Looking at the weekly chart we see that although crude oil slipped under the March low, the commodity rebounded and closed the week above this important support level.
What impact did this move have on the very short-term picture? Let’s examine the daily chart and find out.
From this perspective, we see that crude oil moved little higher on Friday and invalidated the breakdown under the March low. Although this is a positive signal, which suggests further improvement, light crude is still trading under the solid resistance zone created by the green and blue declining resistance lines and also the green horizontal line based on the Jan low. Additionally, Friday’s move is quite small (compared to previous upward moves marked with blue) and materialized on tiny volume, which means that oil bulls are not as strong as it seems at the first sight.
What does it mean for the commodity? In our opinion, all the above in combination with the current position of the indicators (there are no buy signals, which could encourage oil bulls to act) suggests that another test of the support area created by the March low and the red declining support line is very likely. Nevertheless, we believe that the risk of re-entering short positions is too high at the moment. The reason? We think that the best answer to this question will be the quote from our previous Oil Trading Alert:
(…) Please consider the way crude oil declined in January 2015. Black gold declined sharply at first, but the final days (and weeks) of the decline were not sharp – crude oil declined slowly and the thing that was indeed sharp, was the corrective upswing that we saw in the final part of the month. We wouldn’t want to be holding short positions should something like that happened once again and the risk of such action is not negligible.
Summing up, crude oil moved higher and invalidated earlier breakdown under the March low. Despite this (seemingly positive) development, light crude remains under the solid resistance zone, which increases the probability of another test of the red declining support line. Nevertheless, in our opinion, the outlook for crude oil is not bearish enough to justify opening another short positions – at least not yet. We’re happy with the profits that we took off the table recently and we don’t want to risk losing capital before a trade is really justified from the risk/reward point of view. We will continue to monitor the market, look for another profitable trading opportunity and report to you accordingly.
Very short-term outlook: mixed
Short-term outlook: mixed
MT outlook: mixed with bearish bias
LT outlook: mixed with bearish bias
Trading position (short-term; our opinion): No positions are justified from the risk/reward perspective.
Looking at the weekly chart we see that although crude oil slipped under the March low, the commodity rebounded and closed the week above this important support level.
What impact did this move have on the very short-term picture? Let’s examine the daily chart and find out.

Four weeks after gold tumbled to 5-year lows on revelation of far lower Chinese gold holdings than previously anticipated, gold bulls find out that one of the world’s greatest hedge fund managers made gold the biggest holding in his fund in Q2. He also loaded up on 2 large miners.

Stan Druckenmiller’s family office, Duquesne Capital Management, bought 2.9 mn shares of SPDR Gold Trust’s GLD ETF, worth $323.6 million at the end of June, according to the Securities and Exchange Commission’s quarterly filing. Duquesne’s gold ETF purchase bumped the fund’s Facebook holdings off the 2nd position to become the biggest holding in the $1.47 bn fund.
Druckenmiller acted as George Soros’ chief strategist when he helped execute the shorting of the British pound to the extent of forcing the UK out of the Exchange Rate Mechanism in September 1992. Since its inception in 1986, Duquesne has had an average return of 30% per year. In early May, Druckenmiller told Bloomberg in May that interest rates were likely to stay near 0% for 10 years, casting doubt over whether the Fed would ever move to liftoff.
Druckenmiller vs Paulson
Despite the scale and timing of Druckenmiller’s gold position, it remains unclear whether the trade is a long-term bet on the stabilisation of gold resulting from a possible peak in the USD and lack of Fed hikes, or is a short-term trade aimed at taking profit after a brief bounce. The fact that Druckenmiller has also purchased 1.28 mn shares of gold miner Newmont Mining and 3.6 mn shares of copper giant Freeport-McMorcan in the same quarter could indicate he’s in it for the long run.
In contrast to Druckenmiller, John Paulson, the biggest holder of the GLD ETF, sold 11% of his holdings in Q2 after initially slashing them by 50% in Q2 2013 during gold’s 25% collapse that quarter. While Paulson is the biggest owner of GLD, accounting 4% of the ETF, the fund makes up less than 5% of Paulson & Co’s holdings, ranking 7th out of 64 different securities.
As John Paulson is quietly planning an exit out of his gold holdings, Druckenmiller is prominently loading up on the yellow metal.

The US markets continue to s-l-o-w-l-y roll over with the Dow Industrials leading the way. Despite the fact that $INDU moved 100 points higher this week, the intermediate to long-term trend is clearly down. Lots of people talked about the “Death Cross” that occurred on the Dow’s daily chart on Monday when the 50-day simple moving average moved below the 200-day average, but that should come as no surprise to any reasonably-attentive ChartWatchers. Here’s why:

When a market rolls over slowly like this, the first thing to go is the uptrend’s momentum and, yes, we see that as the MACD has been moving lower for months. The next thing to happen is increased interaction with the 50-period moving average. Next up are tests of the 200-period moving average and it draws closer and closer. Then comes a definitive break below the 200-period average and then finally the “Death Cross” occurs – which is where we are at with the Dow.
A longer-term weekly chart shows the slow roll-over more clearly. It really is a “text book” rollover:

The S&P 500 hasn’t rolled-over quite yet but its chart looks very similar to the chart above back in June. The Nasdaq chart offers some hope with the price bars remaining above the 200-day MA for now but something significant needs to change if it is to avoid this same fate.
For more thoughts on the market – including the current breadth and sector situation – be sure to watch the recording of this weekend’s ChartWatchers LIVE webinar. Just click here to get started.
As I say towards the end of that recording, there are still stocks out there with positive momentum and great relative strength – you just need to work a little harder to find them and then watch them closely for signs of weakness.
Take care everyone!
– Chip

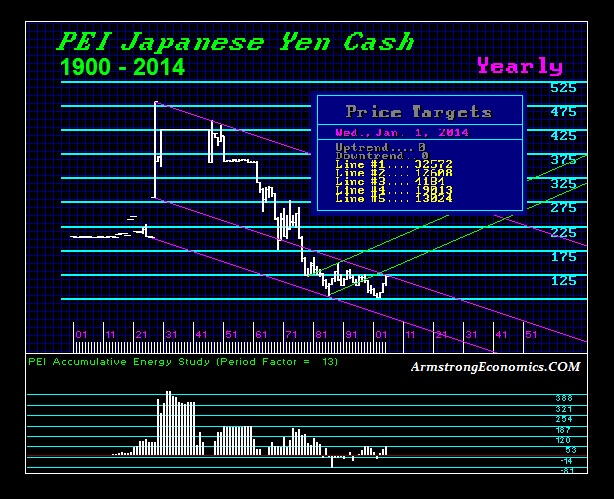
The Japanese yen has peaked against the dollar. The dollar in fact elected a YEARLYBullish Reversal at the end of 2014. This is yet another confirmation that we are facing a strong dollar ahead ushering in this age of DEFLATION, which should start to hit in the USA after October. This is impacting everything not the least of which has been commodities and interest rates as hoarding cash rises. While the commodity bulls have kept touting China from every angle since their consumption reached almost 50% in 2011 of total world output, China’s economy entered a recession with 2007 and despite the recent reaction stock rally, we are also witnessing investment outflows from China. Massive borrowing in Hong Kong and taking the cash back to China masked the trade flows hiding the real trend because people just look at money and not actual trade. As the dollar rises, this helps to extend the deflationary trend in commodities but it also will place pressure on their dollar foreign loans.
No degree of austerity by the ECB will reverse the economic decline in Europe. Socialism has reduced Europe from a major economic power to a shadow of its former self. The bulk of the money supply today is DEBT, not actual currency. Artificial manipulation to inspire austerity fuels deflation and will never achieve a reduction in inflation that Germany is so terrified of these days. The idea of creating money is only the old-school concept of monetary inflation whereas today the bulk of money creation is actually debt. This is not something that can even be PAID off, whereas the only outcome is default.
The global deflationary trend is thus alive and well as we can see reflected in even the Japanese yen. Those who keep touting the hyperinflation scenarios and the collapse of the dollar only looking at the United States, are blind to the global trend. The dollar has elected a YEARLY BULLISH REVERSAL against the Japanese yen and that confirms the dollar rally and the continued deflation and additional signals this year will confirm this trend into 2016.
….more from Martin:
Does China’s Devaluation Reduce the Odds of the Fed Raising Rates?

 Let’s have a look at a long-term perspective on Treasury yields. The chart here shows the 10-Year Constant Maturity yield since 1962 along with the Federal Funds Rate (FFR) and inflation. The range has been astonishing. The stagflation that set in after the 1973 Oil Embargo was finally ended after Paul Volcker raised the FFR to 20.06%.


-
I know Mike is a very solid investor and respect his opinions very much. So if he says pay attention to this or that - I will.
~ Dale G.
-
I've started managing my own investments so view Michael's site as a one-stop shop from which to get information and perspectives.
~ Dave E.
-
Michael offers easy reading, honest, common sense information that anyone can use in a practical manner.
~ der_al.
-
A sane voice in a scrambled investment world.
~ Ed R.
Inside Edge Pro Contributors

Greg Weldon

Josef Schachter

Tyler Bollhorn

Ryan Irvine

Paul Beattie

Martin Straith

Patrick Ceresna

Mark Leibovit

James Thorne

Victor Adair