
Timing & trends
One of the reasons US stocks have had such a nice run is that public companies have been making a lot of money. The profit bounce from Great Recession lows was both big and fast, taking corporate earnings to record levels both in nominal terms and as a portion of GDP.

But since 2012 profits have plateaued. And now they’re about to fall off the table, as most of the reasons for the pop are reversed out. Consider:
Wages Are Finally Rising
Between globalization and automation, corporations have been able to turn their remaining workers into virtual serfs. The next chart looks like a pretty good excuse for armed insurrection. At a minimum it’s a textbook definition of an unsustainable trend.

As the old saying goes, that which can’t continue won’t. Wal-Mart, that quintessential wage-squeezer, is finding this out:
Wal-Mart Lowers Forecast as Pay Raises, Currency Take Toll
(Bloomberg) – Wal-Mart Stores Inc., the world’s biggest retailer, cut its annual earnings forecast for the year, hurt by currency fluctuations and a high-profile pay bump for U.S. employees.
The company now expects profit of $4.40 to $4.70 a share this fiscal year, which runs through January, according to a statement on Tuesday. Wal-Mart had previously forecast earnings of as much as $5.05 a share. Wal-Mart also posted second-quarter earnings that missed analysts’ estimates. Profit amounted to $1.08 a share in the period, excluding some items, the Bentonville, Arkansas-based company said. Analysts had expected profit of $1.12 a share, according to data compiled by Bloomberg.
Wal-Mart shares fell as much as 3.3 percent to $69.55 in New York, the biggest decline since May 19. The stock had already slid 16 percent this year through Monday’s close.
Wal-Mart announced plans in February to raise wages to at least $9 an hour this year and $10 by 2016, along with a related effort to improve training and bolster hours. The move will reduce profit by 24 cents a share, Wal-Mart said on Tuesday. That includes an 8-cent hit in the fiscal third quarter, which runs through October. Wal-Mart had previously said the effort would cost 20 cents this year.
The Dollar Is Just Too Damn Strong
It’s up by 20% – 30% against most other currencies since 2013, raising the effective price of US exports and lowering the value of income from overseas corporate divisions (which come in the form of depreciating currencies like the euro and yen). The impact:
Here’s How Much the Strong Dollar Hurts American Companies
(Bloomberg) – American companies had a rough start to 2015 as they watched profits from overseas subsidiaries slide.
Exactly how much blame should we assign to the currency markets? Two economists at the Federal Reserve have an idea.
U.S. corporate profits fell about 1.4 percent in the fourth quarter last year before plummeting 5.2 percent in the first quarter this year, partly driven by a plunge in the amount American companies’ foreign affiliates earned. Of the decline in overseas subsidiary profits caused by the appreciating currency and cheaper oil imports, about a third probably came specifically from the greenback, Carol Bertaut and Nitish Sinha wrote in a post this month.
Fed policy makers have voiced concern about the strong dollar’s drag on exports, both in Federal Open Market Committee minutesand in speeches (the FOMC will release a new policy statement at 2 p.m. on Wednesday). It’s a major point of concern for monetary policy-watchers as Fed officials debate when to go ahead with the first interest rate increase since 2006.
China Has Stopped Buying Our Stuff
China tripled its debt post-2009 and spent most of the proceeds on infrastructure like roads and airports. US corporations got a big piece of this business, either by selling raw materials and technology to Chinese builders, or doing the work themselves. Now that bubble has burst, leaving lower commodity prices and excess capacity in its wake:
China’s Woes Echo in U.S. Earnings
(Wall Street Journal) – With the U.S. recession behind them and the European fiscal crisis fading, American companies are grappling with a new threat: China’s economic blues.
In quarterly conference calls, U.S. executives recited a litany of pain, from mild to severe, resulting from a slowdown in China’s economy, the world’s second-largest.
Engine-maker Cummins Inc., for example, said demand for excavators in China fell 34% in the second quarter from a year ago with no signs of improvement. For such companies as WeyerhaeuserCo., less construction in China means logs and lumber pile up in the U.S., pushing down prices.
“China was weak in the quarter, and we expect it to be weak as we move forward,” Robyn Denholm, chief financial officer of Juniper Networks Inc., told investors. China pulled down the networking-gear maker’s Asia-Pacific revenues by 3% from the prior quarter; without China, they would have risen 11%.
It comes at a tough time for U.S. businesses. Overall, companies in the S&P 500 index are on track to eke out a 1.2% increase in second-quarter earnings, according to data from Thomson Reuters. That is the slowest growth since fall 2012.
The modest earnings growth was recorded on a 3.5% decline in revenues–the biggest drop in nearly six years–suggesting that much of the profit gain is from cost-cutting, buybacks or other maneuvers, rather than increased sales.
The slowdown in China was evident last quarter in everything from business flights to elevator sales to car purchases. Rockwell CollinsInc. said the flight-services industry has seen international business-jet flights fall 10% this year, largely in and out of China, Russia and the Middle East. DuPont Co., which makes temperature-resistant materials for components in the automotive industry, lowered its growth forecast for the Chinese auto industry in the second half of the year to between 2% and 3%, from past rates of 5% or higher.
Add it all up, and US corporations are looking at another year of falling revenues and much lower earnings at a time when a lot of stocks are priced for, if not perfection, at least high-single-digit growth.
And none of these headwinds are going away. US workers have just begun to redress the past decade’s injustices, and now that higher minimum wage laws have been proven to be political winners, a whole generation of would-be mayors and governors will be pushing them.
China has done exactly nothing to bring its finances back into balance so will either see a 2016 crash or bail out its banks and builders and drift into a Japanese-style lost decade. Either way, its days of sucking up all the world’s extra oil, coal and earth movers are over.
And with the rest of the world in various stages of decline, crisis or chaos while the Fed seems to sincerely want higher domestic interest rates, the dollar isn’t poised to retrace the past year’s spike. Just the opposite.
So it’s a safe bet that US corporations will, in the aggregate, be less profitable next year than this year and — to the extent that earnings dictate market cap — a lot less valuable.

Last week, the global equity markets were quite undecided. China’s and Japan’s equity prices have been moving higher. The Japanese Nikkei reached its highest level since 1996 on Tuesday, August 11th, but then pulled back at the end of the week. Hong Kong’s Hang Seng made a new monthly low and the Australian Market fell to a new 6-month low.
Europe was more decisive. Traders mostly sold stocks. The German DAX, London FTSE, and Zurich SMI all fell to monthly lows by mid-week and did not recover much by Friday August 14th’s close. In Russia, it was much different. Moscow’s MICEX index rallied to its highest mark in 3 months.
In the US Markets, the selling was even more intense. On May 19th,2015, the DJIA topped out at 18,351. The DJIA has failed to make a new high since then and continues to sell off. The decline, so far, has been over 1,220 points which is its’ greatest loss of the year. Last week, began very strong, with the DJIA up 245 points on Monday, August 10th; Tuesday was down 212 points, and by Wednesday, the DJIA had fallen all the way to 17,125, its’ lowest level since February 2nd, 2015. We had a CONFIRMED BEARISH/SELL signal on August 4th, when the Dow Jones was at 17,596. Before I can take any BEARISH positions in the US Markets, this signal needs to be CONFIRMED by the SPX and the NDX-100 as BEARISH, which are currently NEUTRAL/TRENDLESS.
The SPX landed at support levels and found its’ footing, once again. We are getting closer to the cycle lows in September/October when the downward pressure will push it through its’ support trend lines. We are still into a sideways direction. It is a little too early to tell if it will continue the sideways motion or decline in some downward momentum, next week. SPX is undergoing a consolidation in a downtrend trend using the 200- Day Moving Average as support. A daily close below 2076, which does not hold, should bring about the next challenge to the 2040 major support level. The current declining patterns are represented in those of the DJIA,, NYSE and the Dow Jones Transportation Indexes.

The Dow Jones Transportation Index and the Dow Jones Industrial Average are leading the US Markets down during this topping process They are declining further than the other indexes, and the other indexes should be establishing their downtrends, in the near future. With the exception of a monumental one-day market crash, that happens once in a blue moon, bull markets that are topping undergo a drawn-out process that usually takes, at least, many months before bearish momentum finally takes over and a new downtrend emerges.

Considering that US stocks have been in a 7 -year bull market, it would be unreasonable to expect such bullish momentum to change overnight.
Therefore, even though price momentum has been favoring the bulls lately, it is still my belief, that it is dangerous to be invested on the long side of these markets, as of November 25th, 2014.
The stock market is undergoing a big trend change and most of the analysts are missing it, which is normal. They lack the access to “The Predictive Trend System Analytic’s” of a Financial Forecasting Model. My clients have the access to this knowledge from our subscription service that we provide. This knowledge provides you, the client, with THE EDGE that other professional investment firm’s lack.
U.S. equity markets have been fueled by cheap dollars and cheaper interest rates. The combination of the stock market crash from 2008 – 2009, along with a declining U.S. Dollar, has been destroyed by the Federal Reserve Bank (FRB), which has helped US Equities to become a bargain on the global market. This allowed foreign buyers to come in and purchase US Equities, at both a nominal value, based on the markets’ decline, as well as, a relative value based on their home currency. Foreign investors have capitalized on the rise in the US equity market
On November 25th, 2014 my **Global Sentiment Model signaled the “EXCESSIVE EXTREME OPTIMISM”, which provided an exit point on all long US Market positions . Those traders and investors, that remained in long positions, who were not subscribers to our service, at that time, have just been channeling, without any new break outs into new highs.
There is a huge disconnect between the popular sentiment, among the “talking heads” on the news, regarding how these events will affect the September 2015 meeting of the Federal Reserve Bank. The general consensus, that I feel currently exists, is that this could very well push any increase in interest rates, out into the year, 2016. The Federal Reserve Board of Governors has been decidedly dovish, regarding this aspect, and has continued its’ quantitative financial engineering.
Investor Sentiment Readings
High bullish readings in the sentiment stock index usually are signs of Market tops; low ones, market bottoms.
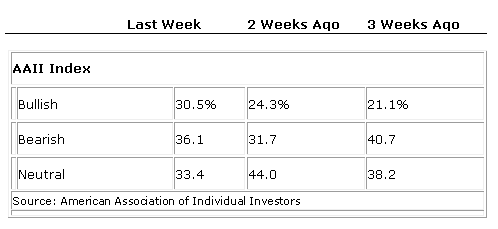
Our current sentiment and technical features are consistent with a major stock market top. This model uses the market sentiment composite which is a measure of investor sentiment. This metric tracks the mood of investors, which is then translated into a probability whether the markets will advance or decline, within the near term, as well as, an undisclosed period of time. It is a contrarian indicator that produces a bullish signal, when market sentiment is overwhelmingly negative, and a bearish signal when markets are overwhelmingly bullish.
We have not disclosed these models’ methodology, and its statistical data, as it is proprietary. We have also not disclosed the correlation coefficient that is used to measure the strength of the linear dependence and its’ algorithms between the market sentiment composite and the 12-month forward return. A trading friend of mine developed this model thirty years ago. For the period of time that it has been implemented, which is now 25 years, it has been predicatively accurate, 100% of the time, prior to any major changes within the US Markets. The last signal that was generated was on November 25th, 2014, which registered “EXCESSIVE EXTREME OPTIMISM” and the broad market had been trading sideways since.

 You wouldn’t know by looking at the US Treasury market, which remained relatively sanguine this week, with only a little panic buying on Tuesday. So 10-year Treasuries ended the week near where they’d started it. But at the other end of the spectrum, the riskiest portion of the junk bond market just blew up spectacularly.

The price of silver has been crushed during the last four years. Prices are ready to reverse. We will know soon enough after the High-Frequency-Traders have their way with prices for paper silver and gold on the CME. But consider:
Casey Research: Top 7 Reasons I’m Buying Silver Now
Gary Savage has declared that “Gold is Now a Buy.”
Adam Hamilton Gold’s Artificial Lows
Richard Russell: Buy Physical Silver Ahead of the Coming Chaos
Gold Sentiment Reaches 2nd Most Negative Level in 25 Years
- The US Dollar peaked in March and has been slipping lower since then.
- Gold peaked four years ago. Silver peaked four years and three months ago. Both are due for a rebound.
Is there anything specific regarding silver, or is it just “hope and change?” Yes!
Daily charts (not shown): Silver hit its low about 2 weeks ago and has weakly rallied since then. Most oscillators show that silver prices are deeply oversold and that momentum has turned upward.
Weekly charts (not shown): Silver prices have closed higher for the last two weeks, and like the daily charts, oscillators are oversold and turning higher.
Anything more? Yes! Long term cycles indicate that silver has finally made a major bottom. I have little faith in short term cycles because prices are so easily manipulated by HF-Traders, but longer cycles are more difficult to manipulate, and more meaningful. When longer cycles align with other confirming evidence, it is significant.
Note the following chart showing monthly silver prices back 25 years to 1990. All major lows in silver prices have been indicated by two long cycles – 82 months and 123 months (82 months times 1.5). The red vertical lines show the 82 month cycles and the green vertical lines show the 123 month cycles.

Monthly Silver Lows 82 Month Cycle Lows
March 1995 Jan. 1995
Nov. 2001 Nov. 2001
Oct. 2008 Sept. 2008
July 2015 July 2015 – Now
***
Monthly Silver Lows 123 Month Cycle Lows
Jan. 1993 Jan. 1993
Oct. 2002 (by a few cents) May 2003
June 2013 July 2013
We could discuss whether the cycles are relevant or not, or if they should be 82 and 123 months, or less or more, but I see the following:
- When two cycles can point to every major low since 1993, they have value.
- The 82 month cycles point to a low in July or August of 2015 – NOW.
- Daily, Weekly, and Monthly oscillators indicate over-sold conditions and that the silver (and gold) market is due to rally. These confirm a silver cycle low for July – August 2015.
- At other 82 month cycle lows prices have rallied a little or a lot depending on other factors, so a cycle low is NOT a guarantee of substantially higher prices ahead.
- But given the last seven years of QE, ZIRP, other monetary manipulations, substantially increasing investment demand for silver, and insane debt levels that inevitably will increase further, it looks like a major low has been reached in silver.
By the way, the next MAJOR silver lows, based on the 82 month and 123 month cycles are due about mid-2022 and late 2023.
What about cycle highs? I see a 94 month cycle in silver highs that might be significant. Note the silver highs in January 1980, 1987, 1995, 2003-04, and 2011. The next high cycle, based on this progression, is due approximately 2019.

Assume that:
- A major LOW in silver has occurred in July 2015 or will occur soon.
- A potential cycle HIGH in silver is due in approximately 4 years.
- War cycles indicate a substantial increase in global conflicts for the next five years. (Larry Edelson and war cycles) Consumer price inflation, higher silver and gold prices, increasing debt, and increasing war cycles trend together.
- In the long term, silver prices trend with US national debt, which we can all agree will continue to grow much larger.
- Silver lows are due in 7 – 8 years, which allows considerable time for prices to spike higher in 2019 – 2020 before they drop into cycle lows in 2022-23.
- There are many reasons for silver to rally substantially from here and possibly two for silver prices to stagnate or continue to fall – global deflation and recession/depressions via crashing economies. But, do you believe that central banks and governments will not fight deflation and recession with every “printing press” available? In that scenario, I think money supply and debt will accelerate higher along with silver prices.
CONCLUSIONS:
- Silver is at or very near an intermediate bottom and an 82 month cycle low.
- Long term cycles indicate another high is due in about four years – plenty of time for silver to rally far higher.
- Fiscal policy and monetary policy – spend and “print” – support much higher prices for silver.
- Even global recession and global deflation are likely to force much more QE and “money printing” to bail out banks, the economy, and governments, and that will push silver prices higher.
- Stack silver and trust that your governments and central banks will devalue their currencies, which they do so effectively.
Gary Christenson
The Deviant Investor


-
I know Mike is a very solid investor and respect his opinions very much. So if he says pay attention to this or that - I will.
~ Dale G.
-
I've started managing my own investments so view Michael's site as a one-stop shop from which to get information and perspectives.
~ Dave E.
-
Michael offers easy reading, honest, common sense information that anyone can use in a practical manner.
~ der_al.
-
A sane voice in a scrambled investment world.
~ Ed R.
Inside Edge Pro Contributors

Greg Weldon

Josef Schachter

Tyler Bollhorn

Ryan Irvine

Paul Beattie

Martin Straith

Patrick Ceresna

Mark Leibovit

James Thorne

Victor Adair