
Timing & trends
- Have US stocks entered a bear market?
- In most assets, MSM (mainstream media) uses a 20% decline as a rule of thumb to define a bear market. While an asset that’s declined 20% might be in a bear market, that rule of thumb is at best a very crude attempt to define the overall price action.
- Different assets require different rules of thumb. Dow Theory provides a time-tested means of classifying the US stock market as bullish or bearish.
- On that note, please click here now. That’s the weekly chart of the Dow Jones Transportation index.
- Next, please click here now. That’s the weekly chart of the Dow Jones Industrials index.
- In terms of time, a Dow Theory sell signal is quite a long process; both averages must make a series of lower intermediate trend lows and highs. In the case of the current market, that may happen, but it hasn’t happened yet.
- The professional Dow Theorist is now watching for an intermediate trend rally to occur in both averages. If they fail to breach the recent highs, that in itself is not a sell signal.
- A sell signal would occur only if both averages then decline and close below yesterday’s closing prices.
- For decades, I have defined the August 7 – October 31 time frame as “crash season“. There’s no question that current US stock market price action is very concerning.
- The real risk of being invested in US stocks during these three months dramatically outweighs any potential reward. That’s because generational wealth can be destroyed in a few days, weeks, or even hours. August is typically the set-up month, and the crash and/or ensuing bear market occurs in either September or October.
- Please click here now. That’s a monthly chart of the Dow Industrials. The uptrend from the 2009 lows has been broken, and the key 5,15 moving average series is rolling over, ominously. I’m a buyer of the Dow only at 14,200, which is where massive buy-side horizontal support (HSR) begins.
- Gold and silver enthusiasts are disappointed that there was not a rush into gold as the Dow tumbled. The SPDR ETF holding did rise modestly, from about 677 tons to 681, but yesterday’s price action was slightly negative.
- The safe haven trade for gold relates more to key bond markets than to stock markets. In my professional opinion, there are two reasons that Janet Yellen would hike rates. The first is to boost money supply velocity (by boosting bank loan profits).
- I also think that Janet shares Alan Greenspan’s concerns about the long term economic problems caused by the size of government. Military spending and entitlement programs don’t do much for money supply velocity. In contrast, by raising rates, Janet can direct institutional liquidity flows away from the T-bond market, away from government, and into the private sector.
- Rate hikes can reverse declining money supply velocity, and potentially quite violently. That’s good news for gold and silver bugs! Obviously, I’m 100% in favour of a September rate hike. Regardless of when it occurs, global stock and bond markets could stage a horrific meltdown after the first rate hike, while gold and silver rally strongly!
- Fortunately or unfortunately, depending on your perspective, most of the price action in the gold market is not directly related to economic events in the West. It’s mainly related to demand for gold jewellery versus mine and scrap supply in India. The key point is that when Indian demand is very strong, gold-bullish events in the West can cause enormous surges in the price.
- Likewise, when Indian demand is tepid, events in the West that “should be bullish” don’t have much effect on the price, and that can frustrate gold enthusiasts. Ominously, when Indian demand is weak (typically from February to July/August), events in the West that are bearish for gold can cause substantial declines in the price.
- The good news right now is that Indian jewellers, refiners, and economists are forecasting very strong demand over the next four months! That means any event in the West that is even modestly bullish for gold could send the price much higher.
- Please click here now. Indian Dore bar imports are surging, with refiners predicting 50% growth this year. The lower duty is a key factor, and I expect this to continue for many years.
- China is also a key source of demand for gold. Please click here now. That’s one take on China, from a key Goldman Sachs analyst. I’ll add that Hong Kong’s stock market sports an average P/E ratio of about 8. The PBOC has plenty of room to cut rates substantially, and the country has almost $4 trillion in FOREX reserves.
- The Chinese stock market is suffering a hard landing, but I don’t see the Chinese economy suffering the same fate. Even if there is a hard landing, China doesn’t need to grow dramatically to boost gold demand consistently. Modest growth is fine, and that’s in play now.
- Another overlooked area of gold demand is Iran. I’ve predicted that Iran will become an economic “powerhouse“, while Saudi Arabia declines. Please click here now. Iran bought a staggering 200 times more gold jewellery from Turkey this year than last year. Switzerland has also started re-exporting gold to Iran. Once all the Western sanctions are gone, I’m projecting that Iranian gold jewellery demand will reach 300 – 400 tons a year very quickly, making it the third most important gold market in the world!
- Please click here now. That’s the daily gold chart. After what is roughly a $100 rally, investors need to be patient, and prepare for a pullback. Please click here now. That’s another look at the same chart. There may be a second flag pattern forming, which is very bullish. A pullback to $1125 is more likely, but overall the chart looks solid.
- Please click here now. That’s the GDXJ weekly chart. There’s a great looking bull wedge pattern in play, with an intermediate term target of $45. I realize that junior gold and silver stock enthusiasts are in a bit of pain after yesterday’s general market meltdown, and there could be more if gold declines to the $1125 area. Investors don’t need to “grin and bear it“. They need to grin and buy it! The strong season for gold is off to a typical start, with gold quite strong, and the stocks very volatile. The junior gold stocks will take the lead baton soon, and start the rise to $45 on the GDXJ chart!
Special Offer For Website Readers: Please send me an Email to freereports4@gracelandupdates.com and I’ll send you my free “Go Pro With Silver!” report. Silver is set to outperform gold, and perhaps quite dramatically, if Janet is successful at reversing money supply velocity. I cover five key silver stocks, with buy and sell points for each of them, and for silver itself!
Thanks!
Cheers
st

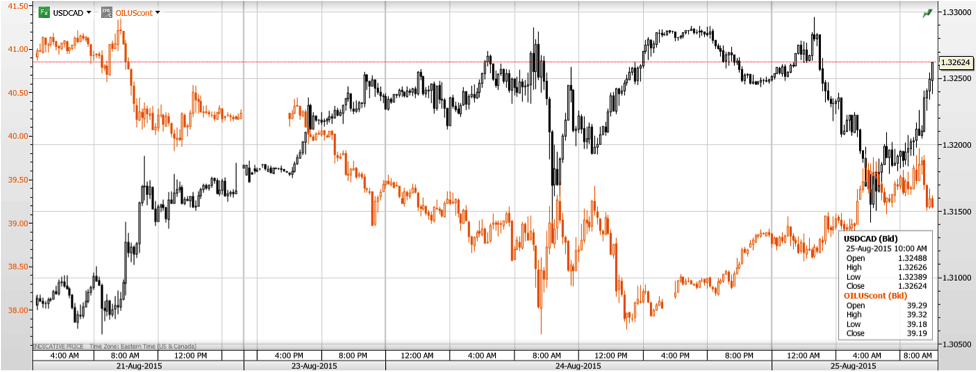
USDCAD Range 1.3148-1.3296
The world didn’t end after all. Yesterday’s financial market madness is today’s sober second thought. The debate is still raging but market price action appears to suggest the moves were a much needed correction of positions that had become excessively one-way. In currencies, that would be EUR and JPY. Both of those pairs have stabilized.
The Chinese equity market price collapse kicked off this week’s global financial panic so it was only fitting that Chinese authority’s stepped up to the plate to help alleviate concerns. In a better-late-than-never move, the Peoples Bank of China (PBoC) cut the Reserve Requirement (RR) by 50bps and the 1 year benchmark lending rate by 25 bps to 4.69% early this morning. S&P futures have rallied on the news and the Dow Jones Industrial Average jumped 320 points at the open.
Yesterday’s market volatility managed to reduce the odds of a September rate hike by the Fed and today’s disappointing US data probably reinforced that view. The FHFA House Price Index printed 0.2% vs forecast of 0.4%
USDCAD has been trading exceedingly choppily since New York walked in, tracking WTI price movements almost tick for tick. The outlook for WTI prices is negative which will limit any Canadian dollar gains.
Technical Outlook
The intraday technicals are bullish while trading above 1.3050 looking for a retest of the overnight peak at 1.3296 and then 1.3450. A move below 1.3040 would suggest that a short term high is in place and target 1.2950. For today, USDCAD support is at 1.3150, 1.3120 and 1.3080. Resistance is at 1.3220, 1.3260 and 1.3310
Today’s Range 1.3170-1.3270
Chart: USDCAD and WTI 10 minute chart showing tick for tick price movement

The Selloff Is a Signal Something Is Very Wrong
Central Banks Have Created ‘Huge’ Systemic Risk
Marc Faber, founder and publisher of the Gloom, Boom & Doom Report, was on Bloomberg after the bell closed on Monday. Faber discussed the recent market sell-off and why he believes that the the central banks have created massive systemic risk. He went on to discuss why he believes there is no growth in China. Faber said that he would put money to work at far lower valuation. He makes its clear that the market is oversold and more companies are hitting new lows than companies hitting new highs.
Click on image for video:

 Fasten your seat belts, this ride is getting interesting. Last week the Dow Jones Industrial Average was down more than 1,000 points, notching its worst weekly performance in four years. The sell-off took the Dow Jones down more than 10% from its peak valuations, thereby constituting the first official correction in four years. One third of all S&P 500 companies are already in bear market territory, having declined more than 20% from their peaks. Scarier still, the selling intensified as the week drew to a close, with the Dow losing 530 points on Friday, after falling 350 points on Thursday. The new week is even worse, with the Dow dropping almost 1,100 points near the open today before cutting its losses significantly. However, no one should expect that this selling is over. The correction may soon morph into a full-fledged bear market if the Fed makes good on its supposed intentions to raise interest rates this year. Have no illusions, while most market observers are quick to blame the sell-off on China, this market was given life by the Fed, and the Fed is the only force that will keep it alive.
To order your copy of Peter Schiff’s latest book, The Real Crash (Fully Revised and Updated): America’s Coming Bankruptcy – How to Save Yourself and Your Country, click here.
For in-depth analysis of this and other investment topics, subscribe to Peter Schiff’s Global Investor newsletter. CLICK HERE for your free subscription.
 The crisis of the global financial markets, that so many have been fearing, looks as though it has arrived.
The importance of the Chinese devaluing their Yuan is effectively starting the process of “de-pegging” its’ relationship to the U.S. Dollar. The change in policy is likely to have unintended consequences which are leading to new problems in todays’ currency wars; especially, as the Federal Reserve lacks the initiative to start increasing their own rates. Chinas’ pre-emptive currency strike complicates the process of the Federal Reserves’ long range policies in which the US Dollar would have been strengthened. The Federal Reserve has paused and believes that this is not the right time to raise rates. Two weeks ago, the global equity markets came to the same conclusion as the global markets plunged, as equity prices accelerated.
The devaluation of the Yuan would normally be viewed as positive for Chinese businesses that will attract a greater marke t share of the world trade, due to the value of a lower currency. Instead, the Chinese market plummeted last week. Their indecision to hold off raising its rate increase would usually have a bullish effect in the U.S. stock markets, but instead they fell to their lowest level of this year. Fridays’ carnage alone being a 530 point decline in the DJIA. The Dow Jones Industrial Average is now down 10% from its’ high of May 19th, 2015 at 18, 351.
Fed Chair Janet Yellen is currently paralyzed and is lacking the leadership and decision making ability of what the next steps should be. I mentioned this in my column dated August 20th, 2015. This is a preview of what to expect in mid-September, rather than the “irrational exuberance” associated with panic and hysteria. We are approaching the 7-year bear market-cycle and the months of September and October typically are the starting months for such trend changes. At that time, markets are destined to remain volatile, with opportunities for both up and down periods which I share in my Global Financial Reset trades within my core newsletter.
The Chinese devaluation of the yuan has sparked the beginning of a continued currency war, in which, many nations desire a cheaper currency in order to aid them with their exports. The US dollar is already considered overpriced. This places the Fed in a dilemma. If they raise short-term rates, for the first time in six years, the dollar will become more overpriced than ever before. Exports will suffer.
India, Russia and Thailand are now preparing for a new currency war. The rest of the world is now scrambling so that they are not the last nations standing to devalue their currencies. The Federal Reserves’ lack of leadership, by increasing interest rates, will cause other countries to devalue their currencies even further.
In terms of equity markets and geopolitical events, the next few weeks are critical.
In my forecast, last week, I stated that the Federal Reserve could not raise interest rates. My views remain fully intact and align with my analysis that the FED has already sparked a “currency crisis”. The financial carnage which we witnessed last Thursday and Friday, was truly global in its scope. On a percentage basis, Chinese stocks crashed even more than the U.S. stocks did. Japanese stocks also crashed, as well as stock markets all over Europe and the emerging market currencies were impacted globally, which is causing an “asset bubble” to explode exponentially.
Our monetary expansion policy has been based on “Quantitative Easing”. Our current resulting deflationary spiral has sucked the global economy into it a dark vortex. Wall Street is going under due to the fact that this time, the Fed is utterly powerless to reverse this trend again.
Our entire economy is currently based on the concept of a “Ponzi Scheme”. It has been built on the expectations that should never have been assumed. The idea that we can create real economic growth and distributed wealth using temporary artificial fixes is absurd.
I do not believe that this crisis will be over by the end of 2015. This is just the start of the crisis. Events will continue to unravel as we move into 2016 and beyond. This existing crisis will continue to last for years and it is going to be very painful beyond what most people can imagine.
Any attempts by the FEDs to raise interest rates, at this time, will further exacerbate the existing economic global disaster.
If my next economic update I will share with you some sobering information one what US equities have experienced in the past 10 months and what it means for traders and investors.
Chris Vermeulen – www.TheGoldAndOilGuy.com – Special Offer


-
I know Mike is a very solid investor and respect his opinions very much. So if he says pay attention to this or that - I will.
~ Dale G.
-
I've started managing my own investments so view Michael's site as a one-stop shop from which to get information and perspectives.
~ Dave E.
-
Michael offers easy reading, honest, common sense information that anyone can use in a practical manner.
~ der_al.
-
A sane voice in a scrambled investment world.
~ Ed R.
Inside Edge Pro Contributors

Greg Weldon

Josef Schachter

Tyler Bollhorn

Ryan Irvine

Paul Beattie

Martin Straith

Patrick Ceresna

Mark Leibovit

James Thorne

Victor Adair