Personal Finance

This only happens about once in a decade…

“a once in a decade opportunity”

UnknownBy late 2002, the national currency of Brazil (known as the “real”) was practically in free fall.

In barely six weeks the real had lost nearly a quarter of its value, and in mid-October 2002, the real hit its weakest level in history at 4 per US dollar.

Thing is, the weakness in the Brazilian currency thirteen years ago wasn’t based on any rational, objective data.

It’s not like the Brazilian government had accumulated $18 trillion in debt, or another $42 trillion in unfunded liabilities.

In fact Brazil’s debt to GDP ratio was less than 50% at the time (compared to over 200% for, say, Italy).

Most of the ‘crisis’ was simply an emotional reaction to what was happening next door in Argentina, which had recently defaulted on its debt.

Foreign investors lumped all of Latin America together and started dumping everything– stocks, bonds, currency.

Many well-heeled Brazilians panicked.

And, believing that the real was on a one-way street to total destruction, they moved their money into the ‘safety and security’ of US dollars.

This turned out to be the wrong move.

Over the several years, the panic quieted and investors realized that none of their fears were backed up by any actual data.

Growth returned. And by August 2008, the real hit an all-time high of 1.55 per US dollar.

Investors who thought they were ‘smart’ by selling the real at its all-time low and buying the US dollar at its all-time high had managed to lose over 60% of their wealth in six years.

This highlights a rather strange sentiment of human psychology: investors seem to prefer buying assets when they’re expensive, and selling them when they’re cheap.

It has to do with a deep flaw in our ability to properly assess risk.

In any situation, there’s always the PERCEIVED risk and the ACTUAL risk.

Perceived risk is based on feeling and emotion. Actual risk is based on data. You can probably guess which one is more accurate.

We can see signs of this in nature; when small animals feel threatened, they’ll often puff themselves up and make intimidating growls, all in an attempt to increase their predator’s perception that a fight would be risky.

The western banking system is another example.

The US government is broke. The US Federal Reserve is nearly bankrupt. The US banking system is pitifully illiquid.

And the FDIC’s insurance fund fails to meet the minimum level of capitalization as required by its own regulation.

This is a system where the ACTUAL risk is quite high. Yet the PERCEIVED risk is shocking low since the public believes that everything in the banking system is OK.

That’s generally the time to be selling… or at least heading toward the exit– when the actual risk is much higher than the perceived risk.

Conversely, when the actual risk is much LOWER than the perceived risk, it’s time to buy.

That’s the case today in developing markets. Especially here in Latin America.

Two obvious examples are Chile and Colombia.

Colombia is still tainted with a reputation of cocaine and kidnapping, even though the country moved on from that long ago. Still, the perceived risk is very high.

Chile generally stays out of the news, and thus it is hard for ignorant investors to distinguish the country from its neighbors.

Both economies are commodity exporters.

And given the weakness in commodity prices, the market perceives the risk for all commodity exporters to be high.

But this is feeling. Emotion. Not fact.

The data show that both countries are among the most reliable and fastest growing in the region with rapidly expanding middle classes and solid public finances.

Chile, for instance, has zero net debt, a solvent pension system, and a banking system with strong levels of capital and liquidity.

Both have robust and growing domestic economies as well.

There’s certainly an economic slowdown right now. But looking at the currency markets, both the Chilean peso and the Colombian peso have lost roughly 40% of their value over the last few years.

That strikes me as absurd.

Are these economies 40% weaker? Is their long-term potential 40% worse?

Doubtful. The fundamental growth trends are still very much intact.

The only difference is that for anyone with incredibly overvalued US dollars to spend, assets in these places are dirt cheap– whether it’s real estate, or shares of well-managed productive companies.

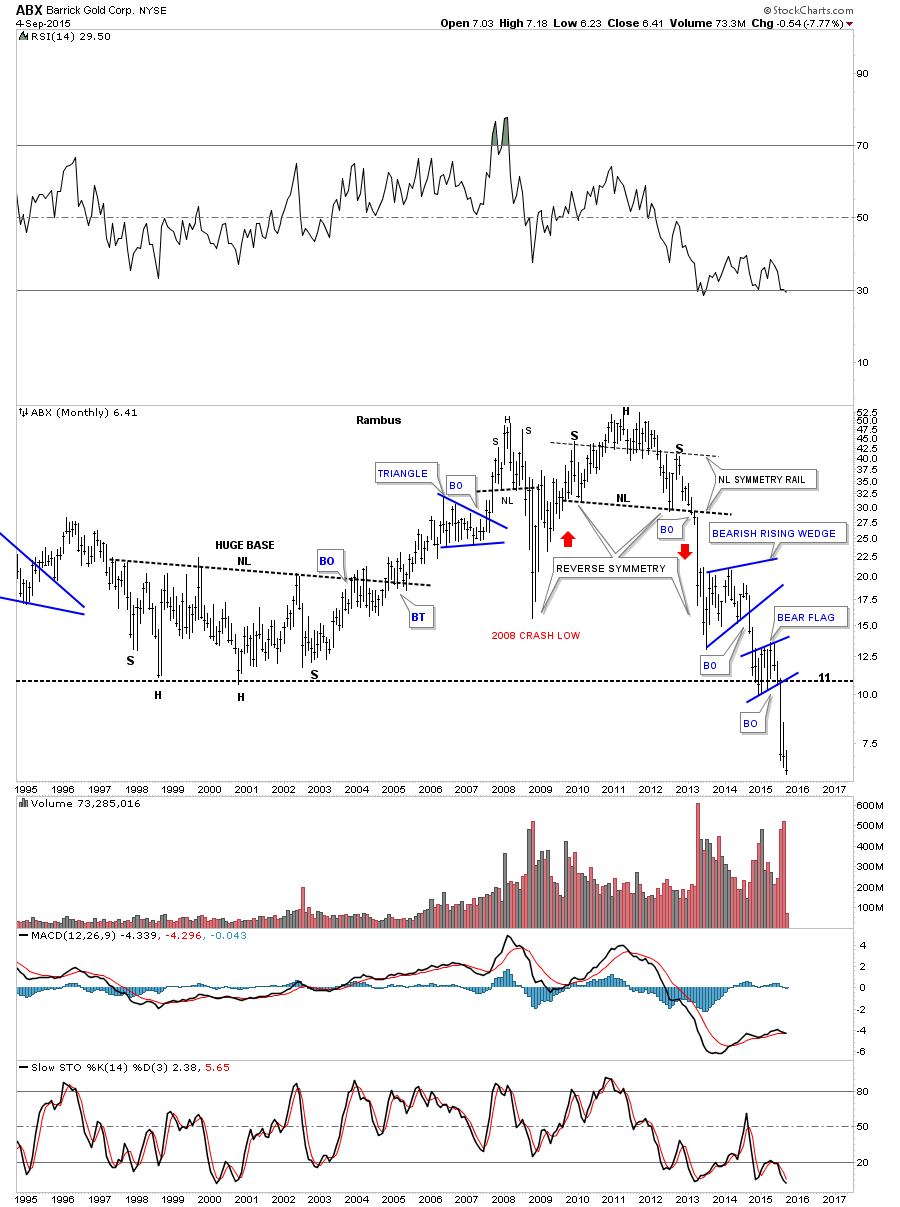
On a related note, I was recently reading an analyst report about mining giant BHP Billiton, in which the analyst lamented the usual risks that weak commodities will hurt the company’s earnings…

… but in the end he admitted that the company had a great balance sheet, management team, and business model.

Right now BHP is trading nearly at the value of its net tangible assets and paying a 7% dividend yield.

And the analyst concluded, almost begrudgingly, that this was a once in a generation (if not once in a lifetime) opportunity to buy into a great company at such a cheap valuation.

I won’t be cliché and say that Latin America (particularly Chile and Colombia) is now a once in a lifetime opportunity. Or even once in a generation.

But given the historical data, it’s pretty clear that this is at least a once in a decade opportunity.

Until tomorrow, 
Signature 
Simon Black 
Founder, SovereignMan.com

Big Cap PM Mining Stocks Cannot Go Lower…Can They ?

In this Weekend Report I’m going to take an indepth look at some the individual precious metals stocks so we can see where they’re at from a short to long term perspective. We’ll start by looking at some of the more important big cap PM stocks as the precious metals stock indexes can’t have a significant rally until this group is ready to run. Anything can happen in the very short term but the further you go out in time the less likely the big trend is going to change on a dime.

The first stock we’ll look at will be a daily chart of the ABX which is one of the biggest of the big caps. From late last year to July of this year ABX built out a shallow bear flag consolidation pattern. The breakout led to our most recent lows around the 6.50 area. Last Friday it gapped below the bottom black dashed S&R line and backtested it at the end of the day. So on the very short term time frame ABX is testing overhead resistance at 6.50.

111

The long term weekly chart shows the massive H&S top ABX built out that reversed its bull market reversing the uptrend into a downtrend as shown by all the consolidation patterns. The close on Friday marked the lowest closing price since the bear market started in 2011 which is a milestone in its own right. You can see how the blue bear flag on the daily chart above fits into the bear market downtrend.

222

The 20 year monthly chart shows the massive inverse H&S bottom ABX built out in the late 1990’s – earlier 2000’s which led to its bull market run. That major low came in around eleven. What this chart so clearly shows is that ABX has now taken out the major low in 2008 and now the other major low at the bear market bottom in the late 1990’s. Note how the recent blue bear flag formed right on that important bottom rail in the 1990’s signalling that if it broke to the downside new lows would quickly follow. As you can see ABX has been in free fall since the break below the bottom rail of the blue bear flag and the horizontal support and resistance line at eleven. This move down could very well mark the capitulation move is underway.

333

Now that you have the idea, in this great Weekend report there are 11 more charts analysed just Go HERE – Money Talks Ed

The Default Next Move For Oil Is Downwards, And Here’s Why

UnknownAs traders, investors and pundits, we all like to think that what we do is akin to a science. We believe that by working harder and being smarter we can give ourselves an edge, that enough research will reveal to us the next move, either a long term trend or an intraday blip on a chart, and that we can profit from that knowledge. Usually, especially over longer time spans, we are correct in that assumption. Sometimes, however, no amount of fundamental or technical analysis will help.

Over the last week or so we have seen some violent swings in the price of oil, swings that in many ways defy logic. At times like these we have to rely on the art, rather than science, of trading and reading markets. That is not to say that traders and investors at home should be simply making wild guesses, it is just that right now, the oil markets are trading on factors other than the fundamental influences that we are used to. It is hard to chart fear and panic.

Panic may seem like a strong word to many, but having been a denizen of a dealing room for most of my working life I can assure you that that is what many have been feeling. The level of overreaction that we have been seeing to every scrap of news over the last couple of weeks is hard to justify in any other way. It is at times like this that some degree of basic technical analysis, a simple identification of support and resistance, becomes all we have to fall back on. To that extent the science of reading these markets is still intact, but once the significant levels have been identified, assessing in what way they are significant is more of an art.

In terms of the benchmark U.S. oil, West Texas Intermediate (WTI), at least now we have some parameters to work in. The drop halted at around $37 and the surge back up that followed itself turned around at just below $50, so, for now at least, that marks the new range. If we accept that, then anybody with even the most basic knowledge of trading will know that, at current levels in the high $40s, a bias towards a short position offers a better risk reward ratio with a closer, logical stop loss level. There are, moreover, a few more subtle, psychological factors amongst market participants that make it most likely that the next move will be downwards and therefore that a short bias is preferable to long.

First and foremost, once new, significant levels have been found, re-testing them is almost irresistible to traders and, in historic terms, the lows of the current range are much more significant than the highs. That traders want to see what happens if they get to a seemingly arbitrary level again may seem like a ridiculous reason for a market that affects the livelihood of millions and the wealth of many nations to move, but such concerns won’t bother floor traders or hedge fund managers. For them, pushing back below $40 is more of an intellectual exercise than anything and if it can be forced there and the level breaks, large fortunes can be made.

Of course, all of this goes out of the window if there is a significant shift in fundamentals, either on the demand or supply side. If decent Chinese economic data is released, for example, or if OPEC announces real production cuts, or if the U.S. rig count drops drastically, then traders’ games won’t matter at all, oil will be headed higher. Until there is any major news, though, it is a question of anticipating what that news will be, or rather the tone of it. Given what has happened since the middle of last year you cannot blame traders for making the assumption that, on balance, any news is more likely to be negative for oil than positive.

It seems, therefore, that all other things being equal, the default path for WTI in the short term is back downwards, to have another crack at the high $30s. There is no real fundamental reason why that should be the case. If anything recent data suggest that when all is said and done, oil trading below where it was in the depths of the last recession is not justified. A recovery at least to around $60 must come soon. Fundamental, scientific analysis like that doesn’t matter at the moment though; what matters is the art of reading the collective mind of the market, and from that perspective oil looks destined for one more push down before sanity returns.


Martin has recently started a mentorship program for a small group of motivated subscribers, find out more here.

By Martin Tillier of Oilprice.com

The Euro and Why the Dollar Will Not Be Dethroned

Draghi-Euro.jpg.pagespeed.ce.ze0-E3GQXnIn the Eurozone, Mario Draghi has announced that his quantitative easing has failed to produce inflation as everyone assumed. After nine months of buying various government debt, the economy is still contracting and their inflated inflation numbers are coming in at .01%. Draghi has announced that they will now buy 33% of government debt issues, which is up from 25%.

The euro has an EXTREMELY RARE virtual TRIPLE WEEKLY BEARISH REVERSAL at 10815. This is not looking very good for Europe. Our model is setting up for the massive dollar rally that the dollar haters just cannot comprehend. They swear the dollar will collapse and the U.S. will lose its reserve currency status out of thin air. They are SO DEAD WRONG; it is a shame for we are about to enter a period where there will not be a single asset class standing without its ardent supporters suffering huge losses.

The HIGHER the dollar rallies, the more likely it is to create an economic storm and losses. If the dollar declines, then all those who issued dollar debt will win. How do we create an economic downturn with a declining dollar? Corporate profits will rise, not fall, and the $9 trillion in dollar-denominated debt will reap huge profits instead of losses.

Then there are the crazies who cannot see the forest for the trees; they send in e-mails that say I am wrong and the dollar will collapse because Russia is abandoning the dollar. They are so lost in thinking that Russia is somehow a major holder of dollars. What is the alternative? There is nothing. A rise in the dollar will inflict the greatest losses worldwide and then the cry for an independent reserve currency will emerge. A declining dollar will NOT dethrone it.


Don Vialoux: The Bottom Line

Most equity markets, economic sensitive sectors and commodities reached an intermediate bottom on or about Tuesday August 25th. Markets have been volatile and likely will remain volatile until after the next FOMC meeting. Ironically, an increase in the Fed Fund rate at that meeting likely will be greeted favourably by equity markets. The much anticipated negative event finally will have occurred. Equity markets are developing base building patterns. Any weakness into the month of September should be considered a buying opportunity, particularly in sectors such as Canadian bank stocks/ETFs, “gassy” stocks/ETFs and fertilizer stocks/ETFs.

Economic news is not a significant influence this week. Traders are preparing for news on Wednesday September 16th from the FOMC meeting. 

Seasonal influences for most equity markets, sectors and commodities during the first half of September generally are neutral. 

Short term momentum indicators for most equity markets and sectors are mixed.

Intermediate term technical indicators (Bullish Percent indices, Percent of stocks trading above their 50 and 200 day moving average) are oversold, show signs bottoming/recovery.

Third quarter earnings and revenues are not promising. According to FactSet.com, 77 S&P 500 companies have released negative third quarter guidance, while 30 companies have released positive guidance. Year-over-year earnings are expected to decline 4.1% and year-over-year revenues are expected to decline 2.6%. Prospects are slightly better in the fourth quarter. Earnings are expected to increase 1.7% while revenues are expected to drop 0.6%.

International events will influence equity markets. Focus is on China. Volatility in Chinese equity markets remains extreme.

….click HERE or the image below to see the positive sector analysis like this example below:

Agrium (AGU)

Fertilizer stocks such as Agrium have a period of seasonal strength from late August until early January. Technical parameters for stocks in the sector recently became encouraging. Strength relative to the S&P 500 Index and TSX Composite Index has turned positive. The stock recently moved above its 20 day moving average. Short term momentum indicators are trending up.

clip image054


test-php-789