
Stocks & Equities

![]()
In This Week’s Issue:
– Stockscores’ Market Minutes Video – What Do the Lines Mean?
– Stockscores Trader Training – Don’t Focus On the Money
– Stock Features of the Week – Stockscores Simple Weekly
Stockscores Market Minutes Video – What Do the Lines Mean?
Ever wonder what the lines of support, resistance and trend lines that chart analysts draw actually mean? This week, I explain the message behind the lines plus provide my weekly stock market analysis.Click Here to Watch To get instant updates when I upload a new video, subscribe to the Stockscores Youtube Channel.
Trader Training – Don’t Focus On the Money
“Anything worth doing is worth doing for money.” – Gordon Gecko, Wall Street
It is generally accepted that money is a motivator; if you link pay to performance, performance will improve. For that reason, many people’s salaries vary with their performance. This is most prevalent on Wall Street where bankers and traders receive most of their compensation in the form of incentive based pay.
In his book, “Drive”, Dan Pink considers whether pay for performance really works. Does dangling a carrot and threatening with a stick cause people to deliver better results? The research finds that this is not always the case.
For very mechanical tasks, incentive based pay does work. A brick layer who is paid by the brick will work more effectively than one who is paid by the hour. However, for tasks that require analytical thinking, performance is actually worse when it is linked to pay.
Pink cites research involving the solving of puzzles. The person who was told she would receive a financial reward if she solved the puzzle in the shortest time performed worse than a person who had no potential for financial reward if the puzzle was solved quickly. The person who was solving the puzzle for the sake of solving the puzzle did it quickest.
I have been teaching people how to trade the stock market for over ten years, teaching a lot of people from many different backgrounds. One constant that I have seen is those who perform the best as traders are those who don’t care about the money. They trade with a set of rules and the discipline to follow the rules, making the money irrelevant.
The market is a puzzle that we want to solve. Why does a focus on money make us ineffective traders, or puzzle solvers?
I am not a behavioral scientist and I have not done the kind of research necessary to really answer that question. However, I do have an opinion based on what I have learned from trading.
Money causes us to focus on something that is irrelevant to the problem. In doing so, it complicates the puzzle, making it more difficult to solve.
If we aspire to make money from the market, we should change our focus to find trading opportunities with a positive expected value. Money will be the determinant of success, but it will not be something that is part of the problem to be solved.
Suppose you buy a stock and it is showing you a profit of $1000. It is near to the end of the month and you need $1000 to pay bills. There is a good chance you will sell the stock because of your need, regardless of what your analysis would tell you about the stock’s potential to move higher.
Money causes a greater problem to our trading when it comes to taking losses. A stock may remain a good hold despite the fact it is showing as a loss. The size of the loss often causes traders to exit the trade simply because the money, and the potential loss of more, causes them too much concern.
Not only can money bring an irrelevant condition in to our problem solving equation, it also tends to bring emotion which hurts our ability to make good decisions. Most people function poorly under stress and the fear of losing money brings stress. When we focus on the money, we trade with emotion and that means we make bad trades.
Every trader has to overcome their emotional attachment to money. Trades have to be based solely on the merit of the trade. Our pursuit must be on doing the right trade, doing good analysis. If we trade to make money, we will lose it! Our chances for success improve when we simply trade to solve the market’s puzzle.

This week, I used the Stockscores Simple Weekly Market Scan strategy to search for stocks that have good, long term weekly charts. I wanted to find some names that have held up well through the recent market turmoil and are moving to new highs after a period of sideways trading. I ran this scan on the Canadian and US markets and found two names that are worth considering for longer term holds:
1. IQNT
IQNT has built an ascending triangle pattern on the weekly chart over the past year but broke out from that pattern last week. Support at $18.

2. FBHS
FBHS broke out through resistance five weeks ago but then pulled back to support as the market corrected. It held support and bounced nicely, giving us the message that the buyers are ready to defend this stock. It made a new closing high last week and looks like it wants to move higher in the weeks and months ahead. Support at $44.

References
- Get the Stockscore on any of over 20,000 North American stocks.
- Background on the theories used by Stockscores.
- Strategies that can help you find new opportunities.
- Scan the market using extensive filter criteria.
- Build a portfolio of stocks and view a slide show of their charts.
- See which sectors are leading the market, and their components.
Disclaimer
This is not an investment advisory, and should not be used to make investment decisions. Information in Stockscores Perspectives is often opinionated and should be considered for information purposes only. No stock exchange anywhere has approved or disapproved of the information contained herein. There is no express or implied solicitation to buy or sell securities. The writers and editors of Perspectives may have positions in the stocks discussed above and may trade in the stocks mentioned. Don’t consider buying or selling any stock without conducting your own due diligenc


I would say without a doubt the most lopsided trade in the world right now is the long dollar trade. Virtually everyone has become convinced that the dollar is going to 110, 120 or even 160.
Folks when everyone is thinking the same thing … then no one is thinking.
So let’s take a look at this “one way” trade.
If the dollar is going higher then it goes without saying that it should continue to make higher highs and higher lows. That is the definition of a rising market. But last month the dollar not only broke the triangle consolidation pattern, but it dropped below the intermediate cycle low in May. That is a failed intermediate cycle. Failed intermediate cycles generally only occur when the larger multi-year cycle is in decline.

Next let’s look at the two largest weighted currencies that make up the dollar index, the euro and yen.
For a currency that we’ve been told is going back to par, I have to wonder why it’s making higher intermediate highs & higher lows, regained the 200 day moving average, and broken the year long down trend line.

The same thing is manifesting in the yen. A major multi-year down trend line has been broken and the 200 DMA recovered.

If these two currencies are bottoming then the dollar is topping.
Next let’s look at a long term chart of the dollar. At the recent peak earlier this year the dollar had retraced almost 62% of the previous bear market. The bull in the 90’s retraced about 50% of the previous bear before rolling over. This bull is almost 8 years old and it may very well be time for the next bear market to begin.

Now let’s go back and take a closer look at the dollar cycle. First note that the last intermediate cycle low occurred in May. The most recent low occurred in August on week 15. Week 15 is generally too early for a final intermediate cycle low. They usually take 20-25 weeks before bottoming. Also note that the dollar has not been able to recover the 10 week moving average.
This is suggesting that the dollar isn’t done going down yet. It should have at least one more smaller daily cycle down before the larger intermediate cycle bottoms.
Now let’s go to the daily charts and we see that indeed the current daily cycle appears to have topped on day 8 having failed multiple times to regain the 50 DMA. A top on day 8 indicates a left translated cycle is now in progress. Left translated cycles almost always drop below the previous cycle low. That means the dollar is now highly likely to fall below the August lows.
Now here’s the thing. Almost no one is prepared for the dollar to drop. Everyone is convinced the dollar is going higher, and everyone is positioned long. Everyone is on the same side of the boat. When that happens invariably the boat tips over.
So here’s what I think is going to happen. the dollar is going to continue down in this left translated cycle, and at some point its going to break through that August low. When that happens the currency markets are going to panic because no one is prepared for the dollar to drop. It will trigger a waterfall decline that will at the very least test the breakout at 88-89. But it may be worse…

As I have noted before intermediate cycle lows in stocks almost always correspond with either a top in the dollar cycle or a bottom, then we can probably assume that the final 7 YCL in the stock market is going to occur in conjunction with the crash in the dollar.
And as the Fed continues to intervene in the markets they are virtually guaranting there will be a second crash in October. I’ve said all along that all the interventions this year to prop up the stock market would just cause a crash, and sure enough that is exactly what has happened. They haven’t learned their lesson and further interventions will just exacerbate the next leg down.
If the second leg down is as large as I think it will be (possibly testing 1550 on the S&P) then the dollar may not stop at 88-89, but could drop to the next support zone (85) in an all out panic.

Now you see why I think that commodities may have found their 3 year cycle low.
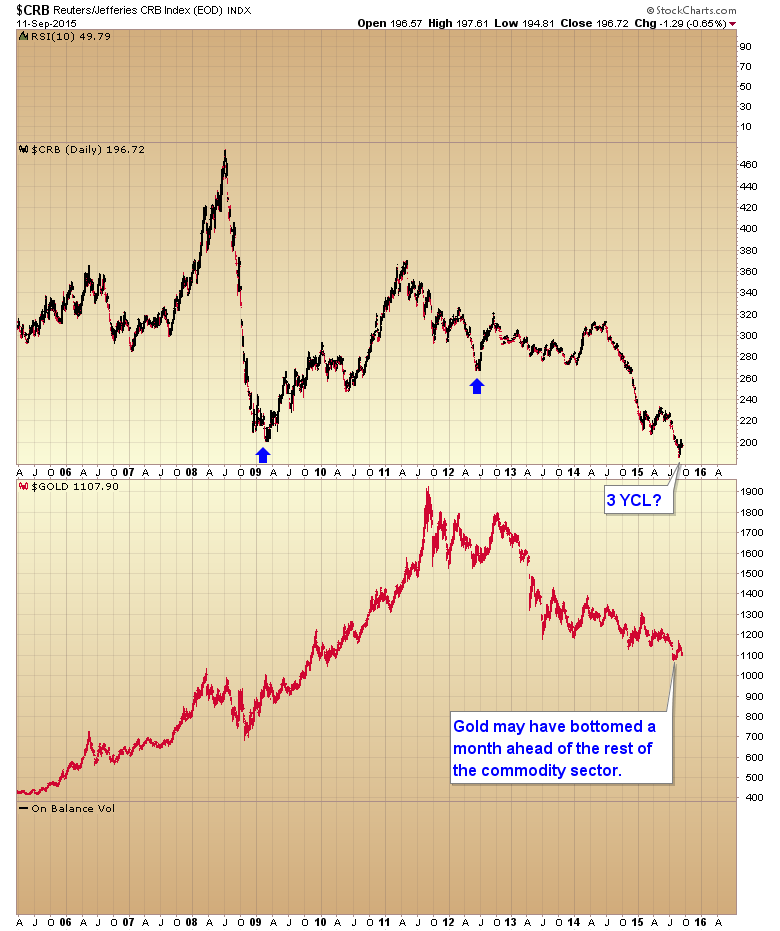
The next leg of the commoditiy bull market was never going to be driven by fundamental supply and demand. It was always going to be driven by the currency markets. So it makes no difference if there is an oversupply of oil. All that matters in the years ahead is that there will be an even bigger oversupply of global currency units. While all commodities should benefit, gold and silver should benefit the most, and the mining stocks are now in position to generate one of the largest bull markets in history.
Remember the larger the bear market, the larger the bull market that follows. The juniors are down 90% and the majors 84%. Without a doubt this has been one of the most destructive bear markets in history. It’s going to spawn one of the largest bull markets any of us will ever see.
Gary Savage, Smart Money Tracker

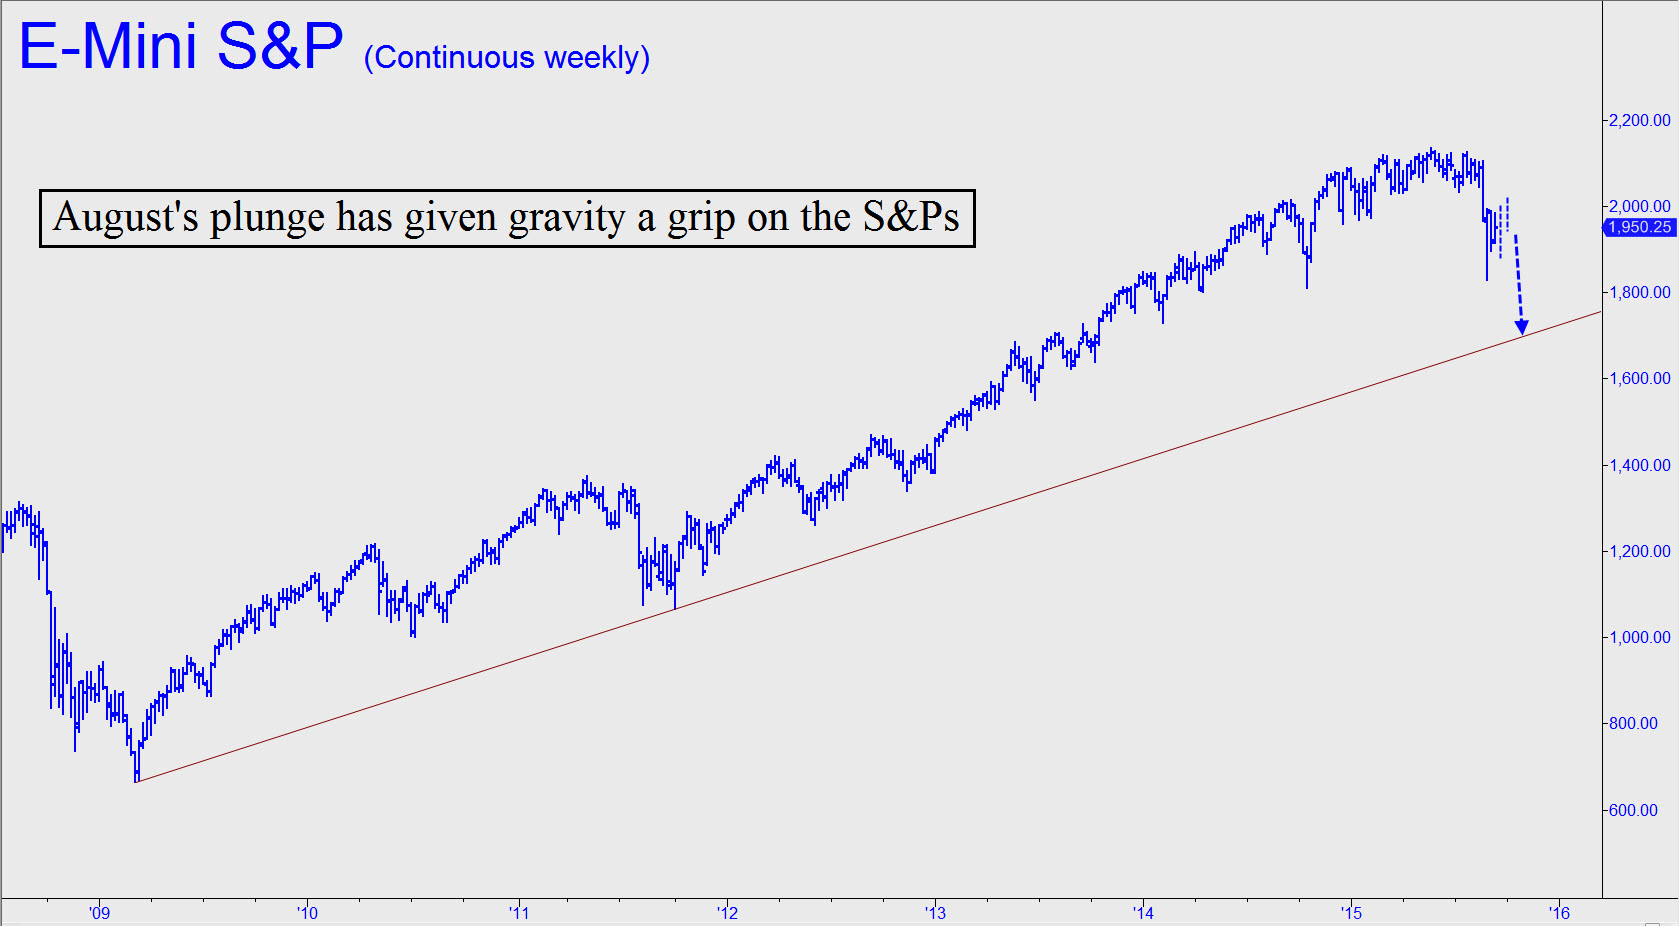
Take a good look at the long-term chart shown and let it liberate your imagination. It’s not difficult to see the force of gravity at work here, pulling the S&Ps toward a trendline that lies 250 points below. Notice how, when the futures swooned last autumn, the recovery was much steeper and swifter than the decline. Not this time. Three weeks into a bounce that has been punctuated by manic, fleeting short squeezes, stocks have yet to recoup even half of the losses suffered during the last two weeks of August.
It would seem that the “story” needed to drive a strong rally simply isn’t there. The Fed can’t loosen because rates are already near zero. China’s economy is weakening rather than strengthening, and Europe is now a full-blown basket case. Adding to this disquieting picture, America’s enemies have grown increasingly bold and seem now to be daring Obama, the weakest and most inept U.S. president in history, to do something about it. Not exactly a comforting picture. Under the circumstances, it seems safe to predict that the S&Ps will fall at least to the trendline shown, currently around 1700. If so, the Dow, now trading for 16433, would fall to 14000 — down 24% from May’s all time high of 18351.
And then what? Elliott Wavesters might say the chart leaves room for a Wave Five surge to new record highs. That would be hard to imagine, considering that the coming recession, or perhaps depression, will leave the U.S. and global economies in a state of smoldering ruin. Whatever happens, we should keep an open mind. First, though, we’ll look for the broad averages to complete the bearish cycle begun in August with a drop to the trendline. The implication is that any rally in the days or possibly weeks ahead is a gift to those looking to get short. Click here for a free two-week trial subscription to Rick’s Picks that will give you access not only to daily trading ‘touts’, bulletins, updates and impromptu trading sessions, as well as to a 24/7 chat room that draws veteran traders from around the world.

 Recent volatile in domestic and global markets has been prominent enough to rattle even some of the most seasoned investors. Summer is a time when most people look forward to sitting back and relaxing in the sun with their favorite beverage. Unfortunately, it is also a period when stock markets weaken due to a lack of interest and lower trading volumes. But while many people can’t be motivated to buy stocks during the warm days of summer, they are typically much more willing to sell them, especially in the face of uncertain market conditions. This volatility also often carries over into the fall. There has been no lack of news over the past few months to cause investors to push the sell button. Weak commodity prices, poor global economic outlook, talk of recession in Canada and rising interest rates in the U.S. and of course a steady stream of poor data from China. Investors are spooked and it isn’t hard to understand why.
The TSX index has dropped more than 12% from its year high less than 5 months ago and markets in the U.S. haven’t fared any better. But rather than being alarmed, KeyStone sees this as an opportunity. Only 5 months ago, we were looking at markets with stretched valuations but the recent sell off is clearly starting to open up some opportunity….in dividend stocks, small-caps and in U.S. stocks as well.
It is clear that the macro-economic outlook isn’t rosy but we wouldn’t necessarily consider it dire at the moment either. In
addition, even in a challenging economic environment it is still possible to find high-quality, growing companies that are selling at a discount due to distressed stock market conditions. We also have to remind ourselves that markets have undergone this cycle in nearly every year since the crash of 2008. Investor optimism pushes stock prices and valuations higher, then gives way to fear, sending markets tumbling, and finally turns back to into optimism (or at least neutral sentiment) allowing stocks to recover. Whether it is concerns over Europe, the U.S., China, or the possibility of rising interest rates, investors have found plenty of reasons to hit the sell button over the last 5 years in the face of any uncertainty. But it has been the investors who remained calm during these periods that profited year after year and the ones that followed the herd who have lost money.
So the question becomes how can investor’s best position themselves with the markets facing the potential for further volatility in the fall? The first piece of advice (as always) is to take a 1 to 3 years view on the stocks you own and buy and don’t be too concerned about what happens in the short term, as long as the fundamentals of your companies remain solid. Beyond that, here are a few simply strategies we employ in almost any market conditions but that are particularly important to remember when we enter period as rocky and the one we are in right now.
- Don’t be a Speculator: KeyStone’s methodology draws a distinct line between the practise of investing and the practise of speculating. Most people who buy and sell stocks would automatically consider themselves to be investors. Our view is that most individuals who purchase shares in individual companies are in fact speculators. Investing is the use of sound strategy, proven techniques, and successful experience. Investing requires that you know what you are doing (or utilize the services of a skilled financial advisor) and that you purchase stocks at less than or equal to their intrinsic value. With respect to companies that have failed to produce revenue or profits, it is basically impossible to assign an intrinsic value of greater than zero as there exists nothing concrete to analyze. We would consider any investment into a company with little to no revenue or profits as being a pure speculation. Investing in industries that are wholly dependent on commodity price (such as oil & gas or mining) should also be considered largely speculative.
- Diversify by Sector: Recent events in the energy sector provide a perfect example of the importance of diversifying into different industries. Being overly exposed to one industry or sector increases overall portfolio risk substantially. This is especially true then we talking about a commodity driven industry like oil & gas or metals where the investment risk is already high. Try to avoid accumulating too many stocks that operate in the same (or similar) industry and particularly those industries that are dependent on commodity prices. Within your 8 to 12 stock portfolio, you will have room to diversify into a multitude of different industries and geographies. Companies that operate in the same industry (and often geography) are exposed to many of the same risks. Diversifying provides significant risk management to your portfolio.
- Enter Stock Positions Gradually: Purchasing a stock position does not have to be an all or nothing proposition. Often times we find a company that appears attractive but see the possibility of its share price moving lower in the short term. If we fill 100% of a position in such a company we get all of the upside exposure but also all of the downside risk. But if we wait for the possibility of a better entry price then we risk losing out on the opportunity all together. For that reason, it is often a wise strategy to fill a position in the company gradually over a period of time. For example, if an investors intention is to eventually fill a position of $10,000 in a particular stock then that investor could fill half ($5,000) or a third ($3,300) of the position initially and then purchase the remainder at a later date. This can help you to mitigate risk and benefit from volatility that occurs through the year. This strategy may also allow you to preserve some capital in the event that December tax loss selling provides further opportunities.
- Buy Strong Balance Sheets: The balance sheet is the financial foundation of a business. Companies with low to reasonable debt levels are in a far better positions to whether an economic storm. Better yet…companies with solid stockpiles of net cash can actually benefit from that storm if they can opportunistically acquire assets in a depressed market. Using an appropriate level of debt is not an unreasonable strategy and certainly a necessity in some industries. However, while companies with excessive debt may enjoy the benefits of leverage during periods of strong economic growth, that debt can be disastrous for investors when the economy and markets turn. The objective as an investor is to ensure that you are not buying a company that is so leveraged with debt which makes it more susceptible to economic and market contractions.
|
KeyStone’s Latest Reports Section 9/10/2015 |

-
I know Mike is a very solid investor and respect his opinions very much. So if he says pay attention to this or that - I will.
~ Dale G.
-
I've started managing my own investments so view Michael's site as a one-stop shop from which to get information and perspectives.
~ Dave E.
-
Michael offers easy reading, honest, common sense information that anyone can use in a practical manner.
~ der_al.
-
A sane voice in a scrambled investment world.
~ Ed R.
Inside Edge Pro Contributors

Greg Weldon

Josef Schachter

Tyler Bollhorn

Ryan Irvine

Paul Beattie

Martin Straith

Patrick Ceresna

Mark Leibovit

James Thorne

Victor Adair