
Stocks & Equities
Wall Street’s proclivity to create serial equity bubbles off the back of cheap credit has once again set up the middle class for disaster. The warning signs of this next correction have now clearly manifested, but are being skillfully obfuscated and trivialized by financial institutions. Nevertheless, here are ten salient warning signs that astute investors should heed as we roll into 2016.
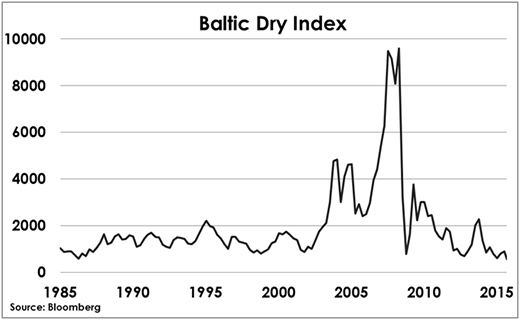
1. The Baltic Dry Index, a measure of shipping rates and a barometer for worldwide commodity demand, recently fell to its lowest level since 1985. This index clearly portrays the dramatic decrease in global trade and forebodes a worldwide recession.
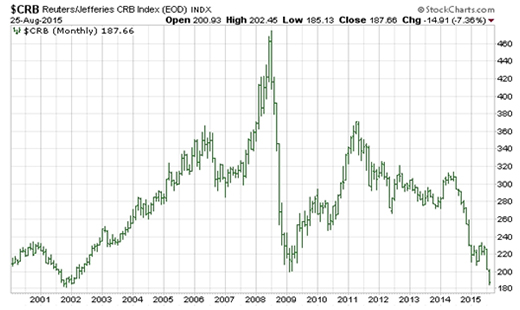
2. Further validating this significant slowdown in global growth is the CRB index, which measures nineteen commodities. After a modest recovery in 2011, it has now dropped below the 2009 level—which was the nadir of the Great Recession.
3. Nominal GDP growth for the third quarter of 2015 was just 2.7%. The problem is Ms. Yellen wants to begin raising rates at a time when nominal GDP is signaling deflation and recession. The last time the Fed began a rate hike cycle was in the second quarter of 2004. Back then nominal GDP was a robust 6.6%. Furthermore, the last several times the Fed began to raise interest rates nominal GDP ranged between 5%-7%.
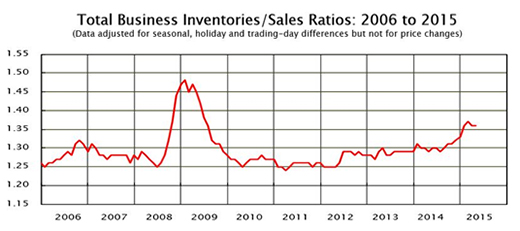
4. The Total Business Inventories to Sales Ratio shows an ominous overhang: sales are declining as inventories are increasing. This has been the hallmark of every previous recession.
5. The Treasury Yield curve, which measures the spread between 2 and 10 Year Notes, is narrowing. Recently, the 10-year benchmark Treasury bond saw its yield falling to a three-week low, while the yield on the Two-year note pushed up to a five-year high. This is happening because the short end of the curve is anticipating the Fed’s December hike, while the long end is concerned about slow growth and deflation.
Banks, which borrow on the short end of the curve and lend on the long end, are less incentivized to make loans when this spread narrows. This chokes off money supply growth and causes a recession.
6. S&P 500 Non-GAAP earnings for the third quarter were down 1%, and on a GAAP basis earnings plummeted 14%. It is clear that companies are desperate to please Wall Street and are becoming more aggressive in their classification of non-recurring items to make their numbers look better. The main point is why pay 19 times earnings on the S&P 500 when earnings growth is negative–especially when those earnings appear to be aggressively manipulated by share buy backs and through inappropriate charges.
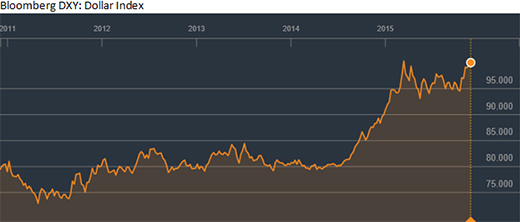
7. The rising US dollar is hurting the revenue and earnings of multi-national companies. Until recently, multinational companies have enjoyed a slow and steadily declining dollar from its mid-1980’s Plaza Accord highs. This decline boosted the translated earnings of multi-national companies. As the dollar index breaks above 100 on the DXY, multinational companies, which are already struggling to make earnings from a slowing global economy, are going to have to grapple with the effects of an even more unfavorable currency translation. In the long-term, a rising US dollar is great for America. However, it in the short-term it will not only negatively affect S&P 500 earnings, but also place extreme duress on the over $9 trillion worth of debt borrowed by non-financial companies outside of the U.S.A.
8. Recent data confirms that the US is currently in a manufacturing recession:
- The November ISM Manufacturing Index entered into contraction for the first time in 36 months posting a reading of 48.6. This is a decline from the anemic October reading of 50.1 and marked the fifth straight month this index was in decline.
- The Chicago purchasing manager’s index (PMI) came in at 48.7 for November signaling contraction.
- The latest Dallas Fed Manufacturing Business Index fell to -4.9, from -12.7 in the preceding month.
- The Empire State Manufacturing Survey came in at -10.7, a fractional increase from last month’s -11.6, signaling a decline in activity and registering close to the lowest levels since 2009.
- The November Richmond Fed Manufacturing Index dropped 2 points to -3 from last month’s -1.
9. Credit Spreads are widening as investors flee corporate debt for the safety of Treasuries. The TED spread, the difference between Three-month interest rates on Eurodollar loans and on Three-month T-bills, has been on a steady rise since October of 2013; at the end of September it was at its widest since August of 2012 at the height of the European debt crisis.
10. The S&P 500 is at the second highest valuation in its history:
- The Cyclically Adjusted Price-Earnings (CAPE) ratio, was 26.19 in November, a value greater than 25 indicates that the stock market is overpriced in comparison to its earnings history. The CAPE ratio has averaged 17 going back to 1881.
- The Q RATIO, the total price of the market divided by the replacement cost of all its companies, historically averages around .68, but is now hovering around 1.04.
- The P/E RATIO of the S&P 500 is around 19 – above the long-term historic average of 15.
- Total Market Cap to GDP ratio is 122, ten percentage points above the 2007 level and eighty percentage points higher than it was in 1980.
- The Price to Sales Ratio for the S&P is 1.82. That is higher than 2007, when it was 1.52 and is at the highest since the end of 2000.
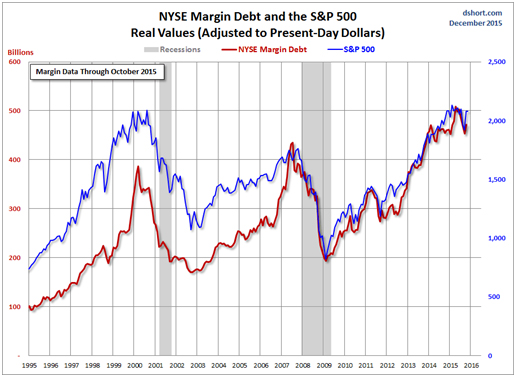
- And finally, Advisors Perspectives chart of inflation-adjusted NYSE Margin Debt and the S&P 500 demonstrates the profoundly over-leveraged condition of the market. Margin debt in real terms is now 20% greater than it was at the peak of the dotcom bubble
If those ten warning signs weren’t enough to rattle investors…this should. The Fed is threatening to do something highly unusual; to begin a rate hiking cycle when the global economy is on the brink of recession. Ms. Yellen has virtually promised to raise rates on December 16th and continue to slowly hike the cost of money throughout next year. Investors should forget about the “one and done” rate hike scenario. The truth is the Fed will be very slowly tightening monetary policy until the fragile US economy officially rolls over into a contractionary phase and the meaningless U3 unemployment rate begins to move higher.
This current economic expansion is now 78 months old, making it one of the longest in U.S. history. There have been six recessions since the modern fiat currency era began in 1971. The average of those has brought the S&P 500 down a whopping 36.5%. Given that this imminent recession will begin with the stock market flirting with all-time highs, the next stock market crash should be closer to the 2001 and 2008 debacles that saw the major averages cut in half.
Total U.S. public and private debt levels have climbed to the staggering level of 327% of GDP. Therefore, humongous debt levels and massive capital imbalances have set up the stock market for its third major collapse since the year 2000. Investors should proceed with extreme caution now that the warning signs have been blatantly explained.

 Dec 15, 2015
 - Tomorrow’s FOMC announcement is arguably the most important Fed event of the past 35 years.
- It’s a defining moment in Janet Yellen’s career, and so I’ve dubbed it as… “J Day”! The bottom line: Janet Yellen is going to attempt to raise interest rates without significant open market bond sales, something that has never been attempted.
- The Fed’s balance sheet has never been this large. The sheer size of open market sales needed to raise and sustain higher rates now, would cause a major panic in stock, bond, and real estate markets.
- The debt-obsessed US government would also face massive pressure from open market bond sales, and could collapse.
- What’s critically important now is that Janet has given her theories a test run, but that’s been with small amounts of capital. Nobody really knows what’s going to happen when she attempts to execute her rate hikes strategy with large amounts of money in the real world.
- So, my somewhat obvious suggestion is for US stock market investors to move to the sidelines until the end of the first week in January.
- The potential reward of a possible market rally over the next three weeks is dramatically overwhelmed, by the risks involved with Janet’s new and untried rate hikes experiment.
- Please click here now. That’s the latest COT report for the mini Nasdaq stock futures contract. Clearly, the smart money commercial traders are net short now, anticipating a sell-off in stocks.
- What’s next for gold? Well, a week ago, I predicted gold bullion would trade down to about $1157, before the Fed makes its announcement. It went to $1058.
- Please click here now. Double-click to enlarge. In the short term, whether gold begins a dramatic rally after “J Day” or not, will depend on the language used in the FOMC statement.
- A potential inverse head and shoulders bottom situation may be developing. To view that scenario, please click here now. Double-click to enlarge. Gold feels solid here, and there seems to be a wave of confidence sweeping through the Western gold community. Just as citizens eventually rebel against oppressive leaders, the overly-bearish tone used by some gold gurus may backfire on them.
- Here’s why: Stock market investors who bought value in the 1970s made a fortune in the 1980’s and 1990’s.
- Those investors never called any stock market bottom, but they bought into it, and made enormous profits in the following years. It’s the same with gold now. I bought gold and silver into the lows of 1976, but I never wasted a single moment of my accumulation time talking about a “bear market”.
- I accumulated gold and silver for nine years in the late 1960s and most of the 1970s. I’d urge Western gold community investors to act in a similar fashion now. Ignore the gold bear market label makers, and buy value, because making labels doesn’t make a gold investor richer.
- Buying value with the sole tool of intestinal fortitude is ultimately 99% of the wealth building game.
- Oil has continued to decline, and it’s the largest component of significant commodity indexes. Interestingly, Janet Yellen has referred to the decline as “temporary”. Please click here now. That’s the daily oil chart. Note the key reversal in play, and the “risk-on” Stochastics signal. Oil traders may be anticipating a very bullish statement from Janet tomorrow.
- Her rate hike experiment has the potential to reverse money velocity, give hope to savers, incentivize banks to put some reserves to work in the private sector, and pressure the US government to shrink itself.Low interest rates benefit debtors, and the US government is the biggest debtor on planet Earth.
- Alan Greenspan and Ben Bernanke both engaged in a horrific strategy. They essentially attempted to turn US citizens into miniature and severely undercapitalized banks. They chopped bank interest rates and thereby “incentivized” the citizens to invest in large businesses, through the stock market. That created a drop in temporary unemployment, and a surge in permanent unemployment.
- The Greenspan/Bernanke policy has been an unprecedented disaster for America. The bottom line for any hope of a real US economic recovery on main street: QE can take a permanent walk, and rate hikes rock!
- To view what is probably the most important chart in the Western world, please click here now. Money supply velocity (M2V) collapsed as the Fed lowered rates to “incentivize” citizens to move money from banks to the stock market.
- During the 2008 financial crisis, the Fed should have revalued gold. Instead, using QE, low rates, and excess reserve payouts, the Fed revalued the banks, and devalued the citizens of America.
- The good news: Janet Yellen has dismantled QE as I predicted she would, and now there’s a 75% chance that she grabs hold of the money velocity bear tomorrow, and ends it too, with upside pressure on interest rates!
- Please click here now . That’s a snapshot of the latest COT report for the yen versus the dollar futures contract. Large FOREX players use the action of the dollar versus the yen as a key indicator for gold. The banks have built a massive long position in the yen, and that’s great news for gold price fans! Please click here now. That’s the daily chart of the dollar versus the yen. The massive head and shoulders top pattern in play is in sync with the COT report, and also bodes well for gold!
- Please click here now. Double-click to enlarge. That’s the GDX daily chart. In addition to “J Day”, tax season is underway now, and will continue until Christmas Eve. Despite these twin forces of negative power, GDX still has not penetrated its recent lows! Gold stock enthusiasts need to buy now, and take a solid stake in what is destined to become generational gold stock lows!
Dec 15, 2015
Stewart Thomson
Graceland Updates
website: www.gracelandupdates.com
email for questions: stewart@gracelandupdates.com
email to request the free reports: freereports@gracelandupdates.com
Graceland Updates Subscription Service: Note we are privacy oriented. We accept cheques. And credit cards thru PayPal only on our website. For your protection we don’t see your credit card information. Only PayPal does.
| Subscribe via major credit cards at Graceland Updates – or make checks payable to: “Stewart Thomson” Mail to: Stewart Thomson / 1276 Lakeview Drive / Oakville, Ontario L6H 2M8 / Canada |
Stewart Thomson is a retired Merrill Lynch broker. Stewart writes the Graceland Updates daily between 4am-7am. They are sent out around 8am. The newsletter is attractively priced and the format is a unique numbered point form; giving clarity to each point and saving valuable reading time.
Risks, Disclaimers, Legal
Stewart Thomson is no longer an investment advisor. The information provided by Stewart and Graceland Updates is for general information purposes only. Before taking any action on any investment, it is imperative that you consult with multiple properly licensed, experienced and qualifed investment advisors and get numerous opinions before taking any action. Your minimum risk on any investment in the world is 100% loss of all your money. You may be taking or preparing to take leveraged positions in investments and not know it, exposing yourself to unlimited risks. This is highly concerning if you are an invetor in any derivatives products. There is an approx $700 trillion OTC Derivatives Iceberg with a tiny portion written off officially. The bottom line:
Are You Prepared?

Call it the “Great Collapse” or the “Epocalypse.” Whatever you call it, it’s about to change the world.
I am referring to an economic crisis so big that the global economy will be forever different after those days. This economic collapse has already begun throughout the world, but I am holding off on using the title “Epocalypse Now” until the US stock market joins the crash. That’s the point at which we’re all in (i.e., at a level where everyone knows it and denial that it is happening falls apart). I anticipate making that call in a matter of days now. Here is where we stand at present:


 High-yield bond weakness has led investors to fear that a recession or bear market may be forthcoming. Widening of high-yield bond spreads (the spread between yields on high-yield bonds and comparable U.S. Treasuries) preceded the start of the stock market downturns in 2000 and 2008, causing many to ask if the latest bout of high-yield weakness portends another downturn.
Here we try to answer that question by looking at characteristics unique to the high-yield bond market and prior periods of similar high-yield weakness.
HIGH-YIELD DISTINCTIONS
Strengths
- Although gold was down for the week it was the best performing precious metal. Perhaps gold was underpinned by the news that China added the most to its central bank gold reserves in five months, according to Bloomberg. Gold prices saw the biggest drop in more than two years, plunging 6.8 percent in November. Data from the People’s Bank of China (PBOC) this week shows the value of gold assets at $59.52 billion at the end of last month.
- Shanghai Gold Exchange withdrawals could be heading for a record year, says Lawrie Williams. Total withdrawals so far this year have amounted to a little under 2,405 tonnes, and with four more weeks of withdrawals still to come, Williams notes that this year’s total could be heading for the high 2,500s. This would be nearly 400 tonnes more than in the previous record year.
- South Africa’s President Jacob Zuma fired his finance minister this week, and replaced him with a little-known lawmaker, according to Bloomberg. The South African rand plunged against the dollar on this news, causing South African gold miners to surge in reaction due to the margin expansion from a falling rand.
Weaknesses
- Platinum was the worst performing precious metal this week. Johnson Matthey noted that platinum remains more expensive than gold jewelry at the retail level in China and that could be hurting its demand.
- According to The Statesman out of Mumbai, the Sri Siddhivinayak temple in India is the first religious trust/institution in the country to respond to the government’s call to invest in Prime Minister Modi’s Gold Monetization Scheme. The institution had an initial investment of 40kg of gold from its chest. It’s clear that there is a continued political push to support the scheme. The Statesman article notes that the famous Mumbai temple has 165kg gold in its vault.
- Barnabas Gan, an economist at Oversea-Chinese Banking Corp., believes that gold bullion will drop each quarter to $950 an ounce by the end of 2016. Gan’s prediction puts gold at the end of 2016 about 12 percent below prices now, according to a Bloomberg article.
Opportunities
- Pessimism by hedge funds came at the wrong time last week, with money managers boosting their gold net-short position to the highest ever just prior to the precious metal’s biggest rally since September, according to Bloomberg. George Zivic, a New York-based portfolio manager at Oppenheimer Funds, thinks Yellen spoke a bit more dovish than people expected. “I think less people are now willing to take the long-dollar, short gold trade,” Zivic said. “It was a very crowded trade.”

- What will happen after the Federal Reserve hikes interest rates? According to Macro Risk Advisors’ (MRA’s) Daily Note, one chart that has been making the rounds, and shows average performance of the U.S. dollar after the Fed hikes, explains a lot. MRA explains that for the past six rate hike cycles, the U.S. dollar has traded lower on average after the Fed starts hiking.
- According to American-German researcher, historian, and strategic risk consultant F. William Engdahl, a gold-backed ruble and a gold-backed yuan could start a “snowball exit” from the U.S. dollar. Engdahl explains that if this happens it would “diminish America’s ability to use the reserve dollar role to finance overseas wars.” He adds that the irony here is the central banks of China, Russia, Brazil and others (that are opposed to U.S. foreign policy course), are forced to stockpile dollars in the form of “safe” U.S. treasury debt. More recent trade deals between China and Russia have specified that either the yuan or ruble would be used to settle balances and not the dollar.
Threats
- Bank of America’s metal analyst Michael Widmer says gold prices could end up falling below $1,000 an ounce in the first quarter of the year. Despite the painful forecast for the precious metal, BofA expects rising inflation in the second half of the year to be “supportive of the beleaguered market,” and says gold could jump to $1,250 an ounce in the fourth quarter.
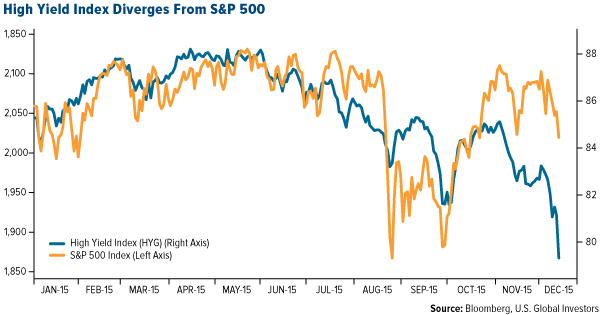
- There seems to be a peculiar divergence emerging between the High Yield Index and the S&P 500 Index, which have previously followed one another closely. As of late, the High Yield Index has plunged but the S&P 500 has largely held up. While the energy sector has dominantly been the source of the stress, this discontent could easily spill over into the banks which lent the energy companies the money to drill. While the broad market has been flirting with all-time highs and gold prices already down significantly, the threat of a market correction could be buffered by rebalancing towards a higher precious metals exposure which is out of favor right now.
- On Friday, prices on junk-bond securities sank to levels not seen in six years, according to Bloomberg. Adding to the shocking news (which comes a day after a well-known Wall Street firm froze withdrawals from a credit mutual fund), billionaire investor Carl Ichan wrote the following on his Twitter account: “The meltdown in High Yield is just beginning.” Gluskin Sheff noted that the corporate bond default rate has jumped to 2.6 percent, the highest in six years, and is poised to rise further to 4.6 percent next year.


-
I know Mike is a very solid investor and respect his opinions very much. So if he says pay attention to this or that - I will.
~ Dale G.
-
I've started managing my own investments so view Michael's site as a one-stop shop from which to get information and perspectives.
~ Dave E.
-
Michael offers easy reading, honest, common sense information that anyone can use in a practical manner.
~ der_al.
-
A sane voice in a scrambled investment world.
~ Ed R.
Inside Edge Pro Contributors

Greg Weldon

Josef Schachter

Tyler Bollhorn

Ryan Irvine

Paul Beattie

Martin Straith

Patrick Ceresna

Mark Leibovit

James Thorne

Victor Adair