
Energy & Commodities
 Incredibly oversold markets finally got some relief last week. By the time we got to last week’s update, world markets were already due for a relief rally.
What they got after the Friday drubbing finally could be classified as that “other shoe” on Wednesday that gave markets the feel they were going down and never coming back. The VIX got above 30, and the other shoe is the kind of thing markets need for an important turn.

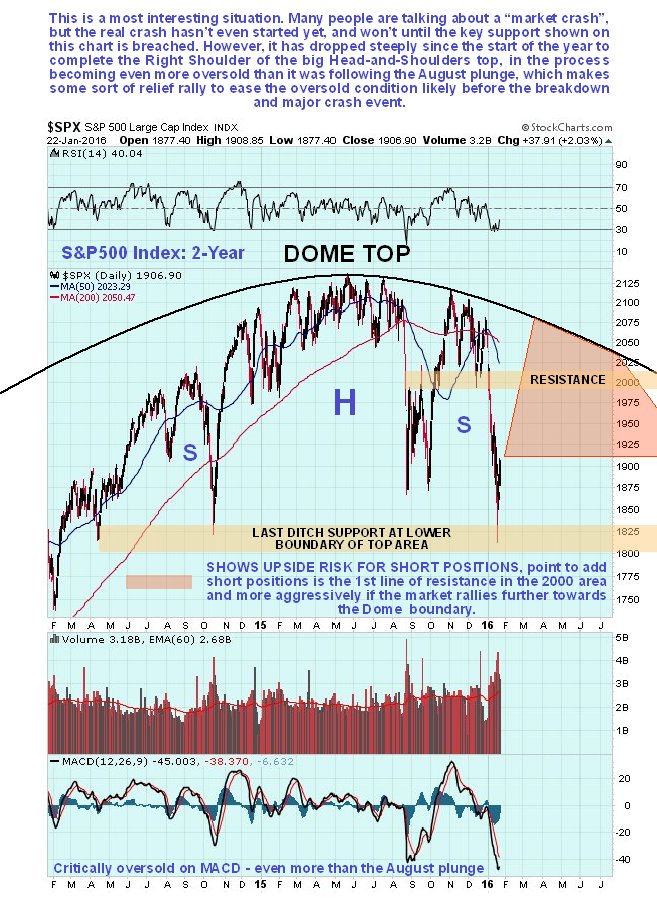
The purpose of this update is to define exactly where we are on the market clock, because if we know where we are, broadly speaking we will know where we are going.
Last week the market plunged to arrive at the last ditch support level in the 1800 – 1850 zone on the S&P500 index that we had earlier defined as marking the lower boundary of the giant Head-and-Shoulders top. Once this level is breached, the full-on crash starts. Because it arrived at this support level in an even more oversold state than it was at the depths of the plunge last August, and because Smart Money has become bullish, it made it unlikely that it would break down and crash just yet, and sure enough the market has started to bounce, which means that the danger has probably abated, for now.

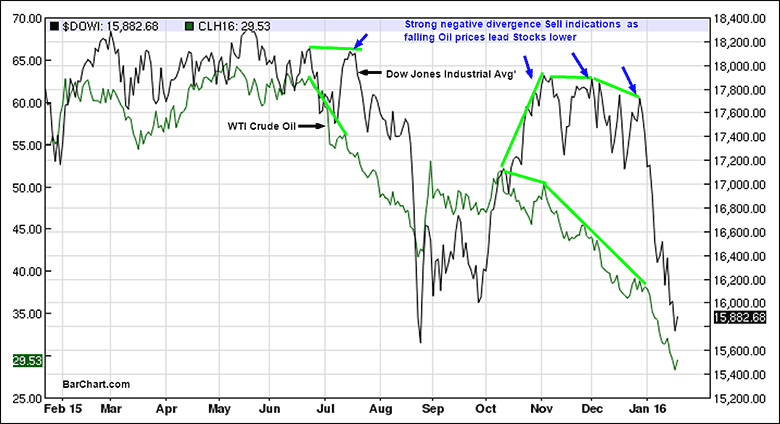
Since North American petroleum production spawned an oil bear market in 2014, energy prices have had a commanding influence on stock prices. As US stock prices repeatedly retested their previous highs last July and again in late December 2015, we witnessed an extreme negative divergence with oil prices signaling trouble for equities. Each time oil fell to new lows the Dow could not resist the rising perception of global slowing and eventually crashed over 10% each time. If soothsayers can determine when oil will bottom, we can be assured that stocks will follow suit.
….for more analysis and larger charts go HERE

 Jim Rogers is shorting U.S. equities and predicting a U.S. stock market crash in 2016.
Billionaire investor and legendary fund manager Jim Rogers is almost certain that the global market upheavals triggered at the beginning of this year will spark a U.S. stock market crash in 2016 that will likely be worse than the global stock market crash of 2008.
In one of his latest interviews, Jim Rogers revealed that he is short on the S&P 500 and Dow indices and long on the U.S. dollar and Chinese markets.
Moreover, Rogers forecasts gold prices will tumble below $1,000 an ounce. He believes that the inflated U.S. dollar will further depress the prices of safe haven investments like gold and silver.
As discussed last weekend at length, the markets are currently exhibiting all the traits of a “correction action.” During these discussions, I have reiterated that you should not “panic sell” into the decline but instead take a disciplined approach to exiting the markets. To wit:
“I know as I write this, that come Monday morning my inbox will be flooded with emails asking if it’s time to go to ‘all cash.’
No. I NEVER suggest being in ‘all cash.’ From a management standpoint, this is never a good idea. Trying to ‘time the market’ is impossible over the long-term and leads to very poor emotionally based decision making. However, as I regularly write, it is our job to reduce portfolio risk to manageable levels to preserve capital over time. We can do that by increasing and reducing our exposure to equity-related risk by paying attention to the price trends of the market.
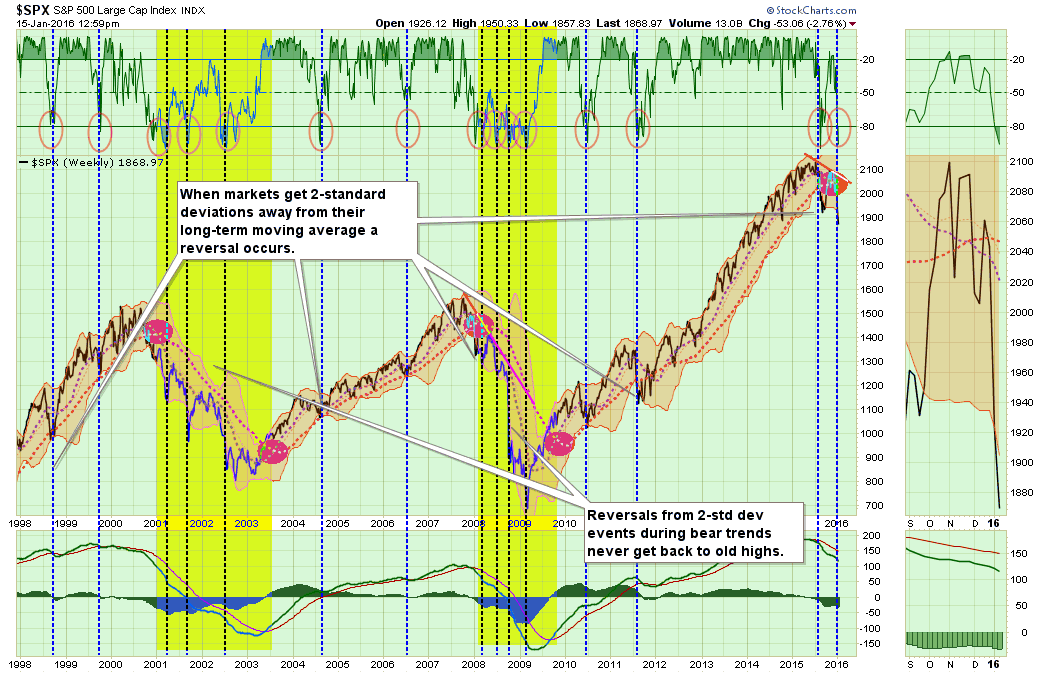
By the time the markets register important “sell signals” denoting a change from the bullish to bearish trend,the markets are generally oversold from the previous selling. This is, as shown in the chart below, always the case.”
….for more analysis and more larger charts go HERE
….for more analysis and more larger charts go HERE


-
I know Mike is a very solid investor and respect his opinions very much. So if he says pay attention to this or that - I will.
~ Dale G.
-
I've started managing my own investments so view Michael's site as a one-stop shop from which to get information and perspectives.
~ Dave E.
-
Michael offers easy reading, honest, common sense information that anyone can use in a practical manner.
~ der_al.
-
A sane voice in a scrambled investment world.
~ Ed R.
Inside Edge Pro Contributors

Greg Weldon

Josef Schachter

Tyler Bollhorn

Ryan Irvine

Paul Beattie

Martin Straith

Patrick Ceresna

Mark Leibovit

James Thorne

Victor Adair