
Timing & trends
An ounce of patience is worth a pound of brains.
Dutch Proverb
Throughout this bull-run, a plethora of reasons has been laid out to indicate why this bull should have ended years ago. Mind you most of those reasons are valid, but that is where the bucket stops. Being right does not equate to making money on Wall Street. In fact, the opposite usually applies. The Fed recreated all the rules by flooding the markets with money and creating and maintaining an environment that fosters speculation.
The reason this is the most hated bull market in history is because there is no logical reason to justify it. In 2008-2009 volume on the NYSE was in the 8-11 billion ranges and sometimes it surged to 12 billion. Before that, every year, the volume continued to rise, this indicates market participation. From early 2010 volume just vanished, it dropped to the 2-3 billion ranges and even lower on some days. Hence, all market technicians and students of the markets assumed that the markets would tank as markets cannot trend higher on low volume and that is where they erred.
We were and still are in a new paradigm; the US government stepped in and started to support the market directly that is why volume dropped so dramatically. However as there were no sellers, the markets drifted upwards. Later on, they got the corporate world in on the scam. They set up the environment that propelled corporations to buy back their shares by borrowing money for next to nothing and then using this trick to inflate t EPS (earnings per share), without doing any work or even increasing the profitability of the company.
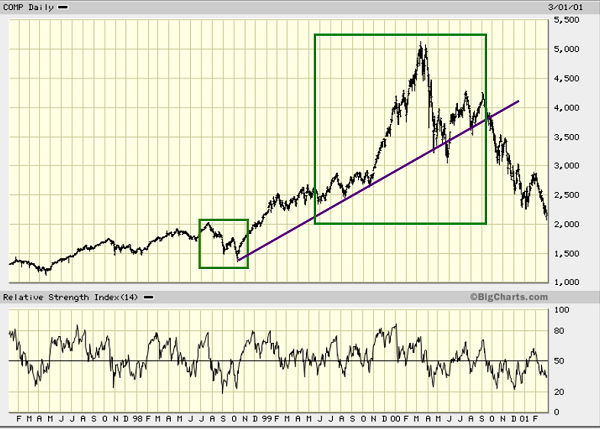
In between a few minor corrections were allowed to transpire almost all of which took place on ever lower volume, to create the illusion that there was some semblance of free market forces at play. The current correction is the only one since 2011 that is real in nature, and it could prove to be a precursor to a larger upward move. If you recall, the dot.com era, the markets corrected strongly in 1998, it looked like the end was near but then the NASDAQ had its best year ever in 1999. It had tacked on gains of roughly 100%. The chart below highlights this dramatic reversal.
Finally, we also have something known as dark pools, this, in essence, allows institutions to purchase large blocks of shares without leaving any tracks. Dark pools now account for over 40% of all U.S stock trades. Theoretically, it provides the government via the PPT (plunge protection team) an avenue to manipulate the markets without leaving any evidence of foul play.
Game Plan
The Fed is hell bent on forcing everyone to speculate, and that is why we have moved into the next stage of the currency war games; the era of negative interest rates. Negative rates will eventually force the most conservative of players to take their money out of the banks and speculate. This process will be akin to another massive stimulus and will provide the bedrock for another monstrous rally.
Make a list of stocks that you would like to own and use strong pullbacks to add to or open new positions in blue chip companies or companies with strong growth rates.

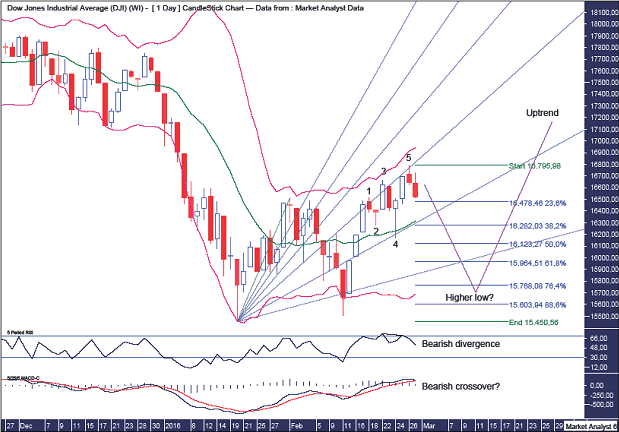
Ahh, the Ides of March. This is a time when stock market participants get the heebie-jeebies and it is my expectation that the first part of the month will play into this superstitious claptrap. However, once an expected higher low is in place, then a big move to the upside will be witnessed that sees March end impressively in the green.
The January analysis outlined the expectation of a move down to put in a higher low. Bingo. The February analysis outlined the expectation of another downside test that puts in another higher low. Bingo again. In this March analysis, I’m gunning for the jackpot prize in calling for one final downside test to put in yet another higher low before price launches higher big time.
Let’s begin the analysis with the daily chart to get an idea of how I believe price is set to trade.


Summary
The negative January closes on U.S. equity indexes is an ominous sign for 2016.
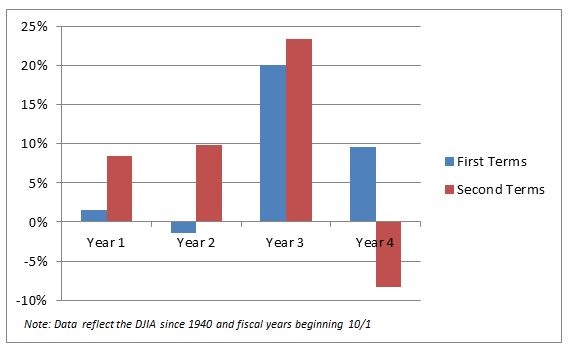
In addition, equities traditionally struggle in election years.
We created seasonal indicators which give high-probability glide paths for trading 2016.

-
I know Mike is a very solid investor and respect his opinions very much. So if he says pay attention to this or that - I will.
~ Dale G.
-
I've started managing my own investments so view Michael's site as a one-stop shop from which to get information and perspectives.
~ Dave E.
-
Michael offers easy reading, honest, common sense information that anyone can use in a practical manner.
~ der_al.
-
A sane voice in a scrambled investment world.
~ Ed R.
Inside Edge Pro Contributors

Greg Weldon

Josef Schachter

Tyler Bollhorn

Ryan Irvine

Paul Beattie

Martin Straith

Patrick Ceresna

Mark Leibovit

James Thorne

Victor Adair