
Bonds & Interest Rates
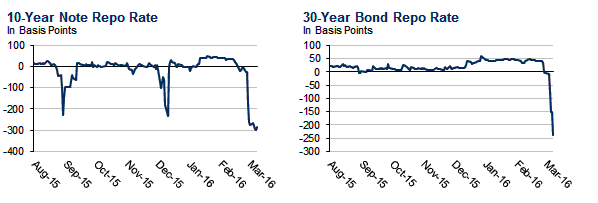
Earlier this week, when looking at the rapidly fraying dynamics in the all-important Treasury repo market, we explained that as a result of the unprecedented, record shortage of underlying paper, the repo rate for the 10Y has plunged to the lowest on record (and even surpassing it on occasion), the -3.00% “fails” rate, an unstable, broken state characterized by a surge in failures to deliver and receive, when one party fails to deliver a U.S. Treasury to another party by the date previously agreed by the parties. Think of it as a margin call issued on a stock in which the responsible party refuses to comply, and is instead slapped with a token penalty, or “fails” fee.
This is precisely what has been going on with the Treasury market for over a week, ever since last Friday when we first pointed out the precarious collapse in the repo rate on the 10Y – traditionally the best indicator of stress in lending markets.
There was some expectation that after this week’s 10Y and 30Y auctions, that the shortage would moderate, however so far that has not happened, and now the last possible renormalization date is when these auctions settle early next week.
For now, however, things are going from bad to worse, and as Stone McCarthy shows in the following two charts, it is no longer just the 10Y which is in trouble: so is the 30Y, which as of this morning is trading near the fails range, or -2.40% in repo.

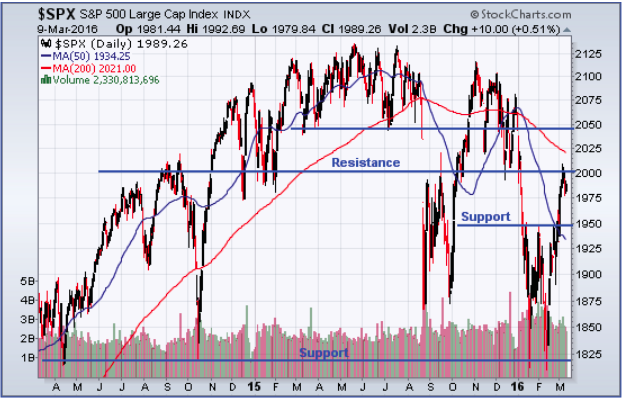
The S&P 500 has broken above 1950, a key resistance level which should now provide support. The next level of resistance is 2000. If the S&P 500 is able to get above this level it will then have a good chance of moving higher to trade in the 2040 to 2135 range that dominated most of 2015. Given the weak fundamen- tal backdrop, it is going to be hard for the S&P 500 to break above its all time highs set last year at 2135. Nevertheless, in the next month and a half, up until the beginning of May, the S&P 500 should be able to
move higher in the short-term.
We are fast approaching the unfavorable six month period for stocks, which starts on May 6th. At this point in time, it is difficult to determine if the S&P 500 will finish its seasonal run early, or if will continue with strong momentum into May. The strength of the earnings and the stock markets reaction should provide some clues. Currently, it is better to give the S&P 500 the benefit of the doubt to move higher, especially if it is able to move and stay above 2000.


The S&P 500 may yield just 2.2% today – but if you smartly invest in stocks that specialize in profitable niches, you can collect 6-11% yields right now. With double-digit price upside to boot!
Real Estate Investment Trusts (REITs) are some of my favorite vehicles for specialization and yield. REITs must have 75% of their assets in actual real estate and earn 75% of their income from those assets. These dividend machines are legally required to pass along at least 90% of their earnings to shareholders.
This is actually the best time to buy REITs this decade. The Vanguard REIT Index ETF (VNQ) pays 3.9% today – just about its highest since 2009. You’ll bank easy double-digit gains buying high quality REITs when their yields are high.
Of course, we must make sure the dividends are well funded, and preferably growing. Which is why I love REITs that specialize. The more unique the focus, the better. It means less competition, and higher rents.
Last week I shared my favorite office REITs – good plays on a quietly booming job market. Today I’ve got 4 unique niche REITs to share with you. They all have natural competitive moats and rising rents powering their big yields.
Four Specialized REITs With Yields Up To 11%

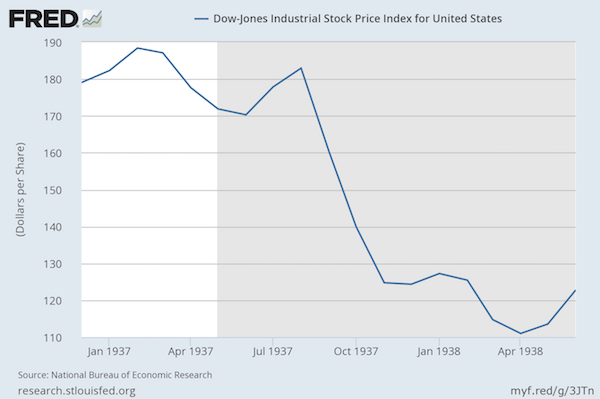
It’s literally 1937 all over again.
Many analysts have called for the Fed not to repeat its mistake of 1937.
That mistake?
Raising rates when the economy was already weak. Doing this prolonged the Great Depression.
However, few commentators point out WHY the Fed raised rates in 1937.
The reason?
CPI hit 3.7%.

Notice that by raising rates the Fed kicked off another terrible round of deflation with CPI falling from 3.7% to -2.0% in JUST ONE YEAR.
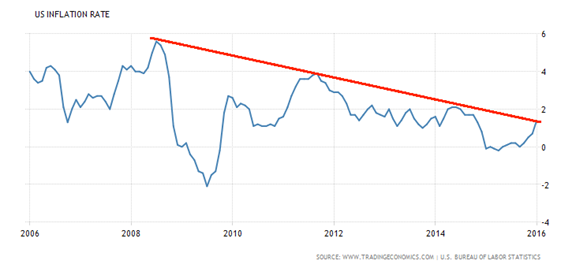
Fast forward to today. The US’s inflation rate is moving vertical…
Core inflation is already ABOVE 2%.
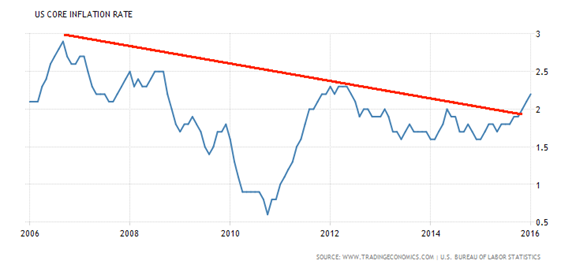
The Fed is cornered. If core inflation continues to rise the Fed will be forced to raise rates, kicking off another market meltdown. In 1937 when the Fed hiked rates during a weak economy, stocks plunged 40% in the following 12 months.
Buckle up, it’s coming.
Best Regards
Graham Summers
Chief Market Strategist

Today’s videos and charts (double click to enlarge):

US Dollar & Stock Market Video Analysis
Gold & Silver Bullion Video Analysis
Precious Metal ETFs Video Analysis
Trader Time Swing Charts Video Analysis
SFJ Individual Stock Core Positions Video Analysis
Thanks,
Morris


-
I know Mike is a very solid investor and respect his opinions very much. So if he says pay attention to this or that - I will.
~ Dale G.
-
I've started managing my own investments so view Michael's site as a one-stop shop from which to get information and perspectives.
~ Dave E.
-
Michael offers easy reading, honest, common sense information that anyone can use in a practical manner.
~ der_al.
-
A sane voice in a scrambled investment world.
~ Ed R.
Inside Edge Pro Contributors

Greg Weldon

Josef Schachter

Tyler Bollhorn

Ryan Irvine

Paul Beattie

Martin Straith

Patrick Ceresna

Mark Leibovit

James Thorne

Victor Adair