
Timing & trends
Take Advantage of the Trading Machines
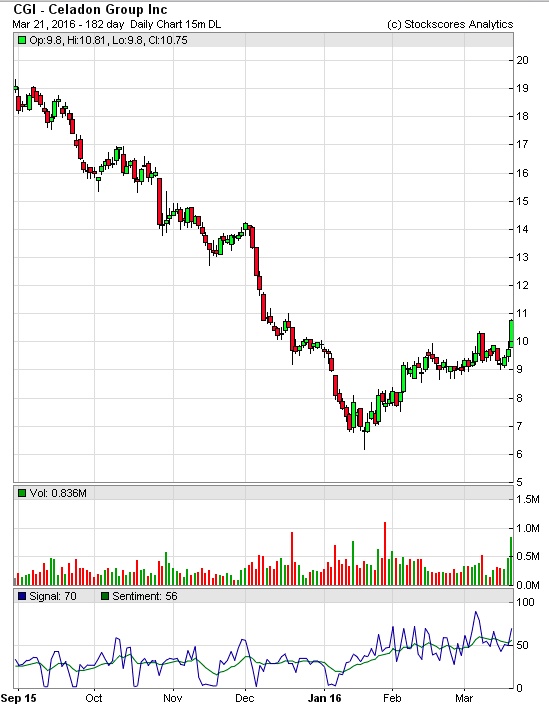
Computerized trading is the dominant force in the market today. More than half of daily trading volume is driven by computers. What is the difference between high frequency trading (HFT) and algorithmic trading? How does it affect investors and how can traders overcome the effects that machine based trading has on the market? Here are my thoughts.
First, let’s differentiate between HFT and algorithmic trading. High frequency trading uses advantages in speed to profit. Extremely fast computers coupled with extremely fast connections between markets allows the HFT computer to take very small profits in fractions of a second. It is a game that individual investors cannot play because the resources required make the barrier to entry very high.
….read entire report including stocks of the week HERE

Sent to subscribers on March 21, 2016, 6:56 AM.
Briefly: In our opinion, no speculative positions are justified.
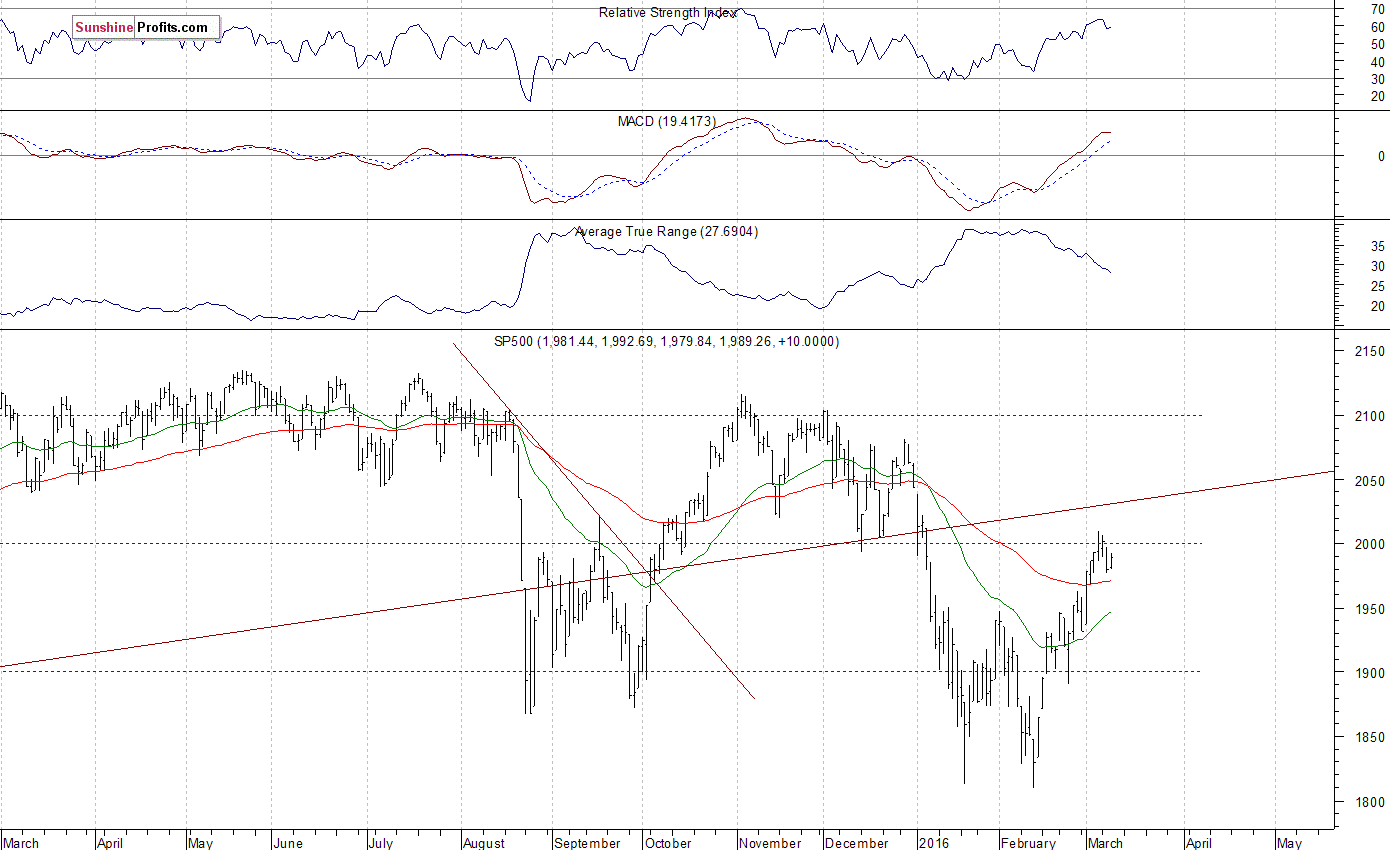
Our intraday outlook is now neutral, and our short-term outlook is neutral. Our medium-term outlook remains bearish, as the S&P 500 index extends its lower highs, lower lows sequence:
Intraday outlook (next 24 hours): neutral
Short-term outlook (next 1-2 weeks): neutral
Medium-term outlook (next 1-3 months): bearish
Long-term outlook (next year): neutral
The main U.S. stock market indexes gained 0.2-0.7% on Friday, extending their short-term uptrend, as investors reacted to some economic data releases. The S&P 500 index is at the resistance level of 2,050, after breaking above the level of resistance of 2,040, marked by the early January daily gap down at 2,038.20-2,043.62. The next important level of resistance is at around 2,080, marked by the late December local high of 2,081.56. On the other hand, support level remains at 2,000 mark, and the next support level is at 1,960-1,980, marked by previous level of resistance. There have been no confirmed negative signals so far. However, we can see some technical overbought conditions. Will this uptrend extend even higher? The index continues to trade within a slightly descending medium-term trading channel, as we can see on the daily chart:

Our main theme has been that the ironclad post-2011 confidence in the Federal Reserve among conventional market participants would slowly but surely start to fade because macro parlor tricks, so vigorously employed by the Bernanke Fed, were only tricks or in some cases (Operation Twist) borderline magic, after all.

At biiwii.com (still unsure if or in what capacity the site may reappear) we used to have fun with clown car videos, as the various Fed members piled out honking horns, doing somersaults and shouting incomprehensible phrases and announcements.
Like Rosco’s clown car above, that is all fading away now. The pretense that the Fed is the steward of a sound financial system and currency has been stripped away. We are no longer anticipating a waning of confidence. In rolling over last week and playing dead, the Fed announced for all the world to see that it is no more secure or respectable than the clown known as ‘the Draghi’, Kuroda the Klown or the troupes in Canada, Australia, England and China’s Central Planning.
The US Fed, through no good work of its own was the beneficiary of a Goldilocks environment in which global economic pressures resulted in capital flight into the US.

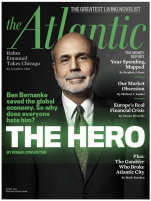
That was all well and good while the Goldilocks benefit lasted. The Fed, or more accurately Benny the Clown was made out to be a genius, somehow managing to promote inflation and asset market appreciation while suffering none of the traditional drawbacks, like outwardly visible inflation problems.
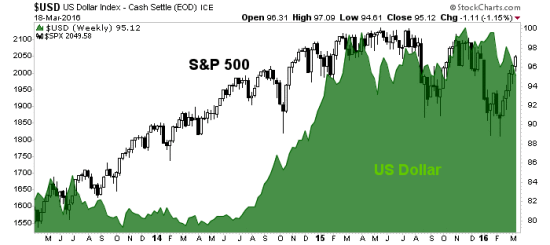
An upward surge in the US dollar (reserve currency) due to global deflationary pressures only cemented Benny’s already bestowed reputation as “the Hero”.
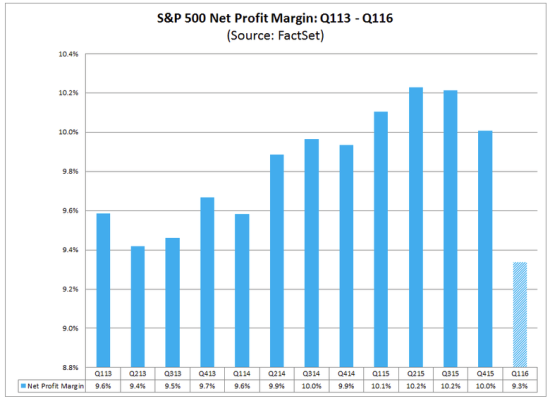
But then the stock market started to roll over under the pains of US dollar strength. This was due to weakening exports and manufacturing in general. Here in Q1 2016 we find a deceleration in corporate profits, hot off the press from FactSet.com:
Now we again consider the chart of the S&P 500 and US dollar above. Taking it a step further, consider the real reason that the stock market has risen post-2008, unbridled inflation. From Slopeofhope.com:
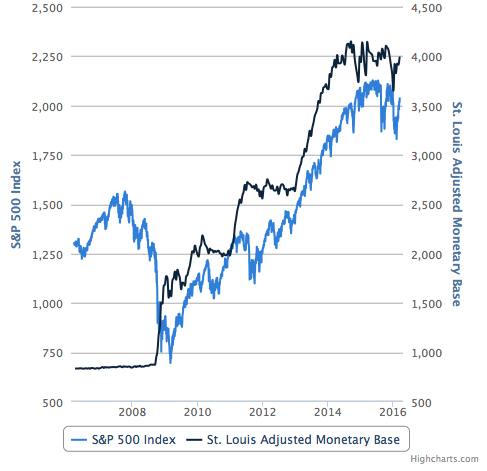
The entire span of the black line – during its upward surge phases – was Bernanke. The roll over? That is happening on Janet Yellen’s watch. She is not to blame.
For some time after Bernanke had taken center ring I continued to focus on Alan Greenspan. That is because the ‘nank was sent into the Big Top to clean up the fallout from Greenspan’s inflationary mess.
Today we look back to Benny the Clown and the tricks he played on us, with poor Janet Yellen the fall guy in waiting. It’s a sort of tradition, a right of passage for those who would assume the lead roll in this show. One employs a bag of tricks and the other… holds the bag.
Yet multitudes of conventional market participants have proceeded on as if any of this were normal. They are like the poor elephants in the circus, trained to just go along with the show, the planners of which are well above their pay grade. But the biggest takeaway from last week, from NFTRH’s perspective, is that our theme of waning confidence got rammed to the forefront of the average investor’s consciousness.
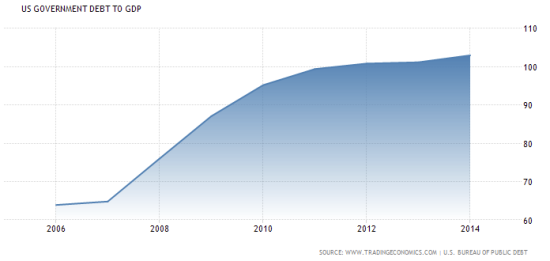
The Fed appears ready to continue the inflation, this time without pretense or the aid of a global deflationary ‘Goldilocks’ benefit. Aside from the stock market and economic motives, might the Fed also be considering the post-2007 buildup in Debt-to-GDP? A little inflation can go a long way in inflating away a government’s debt problems.
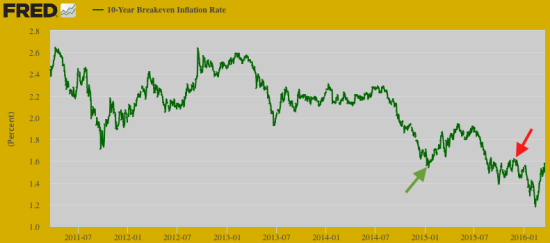
We will continue to watch for market-based inflation signals in items like the Silver-Gold ratio (to be covered later in the report) and Treasury bonds vs. inflation indexed T bonds. While inflation expectations have bounced to date, a breakout in inflation expectations would only be signaled by a rise above the 1.6% area.
Regardless, the Fed is dropping its pretense and starting to gets serious in the game of global inflationary Whack-a-Mole.

NFTRH 387 then gets down to business and covers the relevant markets with respect to US and global policy and the inflation they are attempting to promote.

Strengths
- The best performing precious metal for the week was silver, up 2.87 percent. Investors own the most silver in exchange-traded products in seven months, boosting holdings from a three-year low, according to ZeroHedge. This rebound comes as hedge funds and other money managers hold a near-record bet on further price gains.
- Physical gold ETF holdings have increased by over 270 tonnes since reaching their cycle-low in early January, reports TD Securities, coinciding with an 18 percent rally in the gold price. In contrast, only three tons of gold have been collected so far in India’s newly announced deposit plan. Macquarie raised its 2016 gold forecast for the precious metal by 4.8 percent, while Morgan Stanley announced its gold price outlook for the year up 8 percent to $1,173 per ounce.
- Calico Resources Corp. and Paramount Gold Nevada Corp. announced this week that Paramount has agreed to acquire all of the issued and outstanding common shares of Calico. Particulars of the transaction show that holders of Calico Shares will be entitled to 0.07 of a share of common stock of Paramount, in exchange for each Calico Share held. This represents an implied offer premium of 49.2 percent per share.
Weaknesses
- The worst performing precious metal for the week was gold, still up 0.34 percent. Gold consolidation is underway says UBS, adding that this should be healthy for the market. In its Global Precious Metals Comment this week, the group points out that pullbacks in gold so far this year have been relatively shallow and short-lived, not really offering investors many opportunities to enter at better levels.
- While the Indian jewelry trade continues its stir for withdrawal of the 1 percent excise duty announced in the Union Budget, the finance ministry does not indicate a compromise, reports the Business Standard. The strike entered its seventeenth day on Thursday. One ministry official said, “There is no question of a rollback.”
- B2Gold Corp. announced this week its approval for Gold Prepaid Sales Financing Arrangement, or prepaid sales, of up to $120 million. As stated in the company’s release, the prepaid sales (in the form of metal sales forward contracts) allow B2Gold to deliver pre-determined volumes of gold on agreed future delivery dates in exchange for upfront cash pre-payment. These financing arrangements will help fully fund the Fekola Mine Construction.
Opportunities
- CLSA’s Christopher Wood believes that the European Central Bank’s meeting last week reinforces the fact that central banks globally are addicted to unconventional monetary policies, reports Barron’s. Prior to the Bank of Japan meeting this week, Wood said that pension funds should have 70 percent exposure to the precious metal. Wood’s logic says that as we adjust for rising income, gold could peak again at $4,212 an ounce in an ultimate bull market.
- Bloomberg reports that in Japan, negative interest rates are boosting gold demand (according to the nation’s biggest bullion retailer). The same is true in Germany, where reinsurer Munich Re has boosted its gold and cash reserves in the face of the negative interest rates imposed by the ECB, reports Reuters. Last week the ECB cut its main interest rate to zero and dropped the rate on its deposit facility to -0.4 percent from -0.3 percent.
- Roxgold Inc. announced results from its latest drilling project this week from the QV1 structure at the Bagassi South regional exploration target, 1.8 kilometers to the south of the 55 zone. “Results from this program further confirm the potential at QV1,” stated John Dorward, President and CEO of Roxgold. These results make a stronger case for owning Roxgold and likely increased the prospect of Roxgold as a significant take out candidate.
Threats
- The CSFB “Fear Indicator” (specifically designed to measure investor sentiment, and represented by the index prices zero-premium collars that expire in three months) has never been higher, writes ZeroHedge. This could indicate that institutional investors are not believers in the equity rally and that there is more demand for put protection, continues the article, a sign of fear in the marketplace.
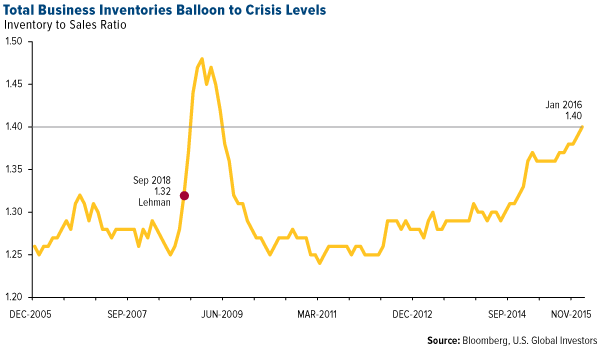
- Total business inventories have ballooned to crisis levels, according to a report from Macro Strategy Partnership. This can be seen in the chart below which shows the inventory-to-sales ratio. Inventories are up another 1.8 percent year-over-year to $1.81 trillion, and are up 18.5 percent from the prior peak in August 2008 while sales are only up 5.8 percent over the period.
- Barclays thinks that the rally in commodities is overdone, and although economic data has improved, it is not enough to support current prices. With a fragile global economy still in place, the group believes that a turning point for commodities is still some way away.

Gold and gold stocks have refused to correct for more than a few days at a time. Weakness is being bought and quickly. Gold has gained over $200/oz but not corrected by more than 6%. The miners (GDX) have endured three roughly 10% corrections in the past six weeks but nothing greater. A few weeks ago we noted a comparison to the 2008 rally which hinted that miners could correct 20% before moving higher. So far, no dice. Many gold bulls continue to expect a correction while losing sight of the bigger picture: precious metals are in a new bull market.
Many have expected a correction due to the CoT, which shows a net speculative position of 37.6% of open interest. While this figure appears high, we should note that from 2001 through 2012 the net speculative position often peaked from 50% to 60%. Moreover, everyone has completely missed the rise in open interest, which reached a more than 4-year high! Open interest is not a leading indicator but a confirming indicator. Strong increases in open interest validate the strong increases in Gold. The recent increase in open interest mirrors the increases that followed the 2001 and 2008 lows in Gold.
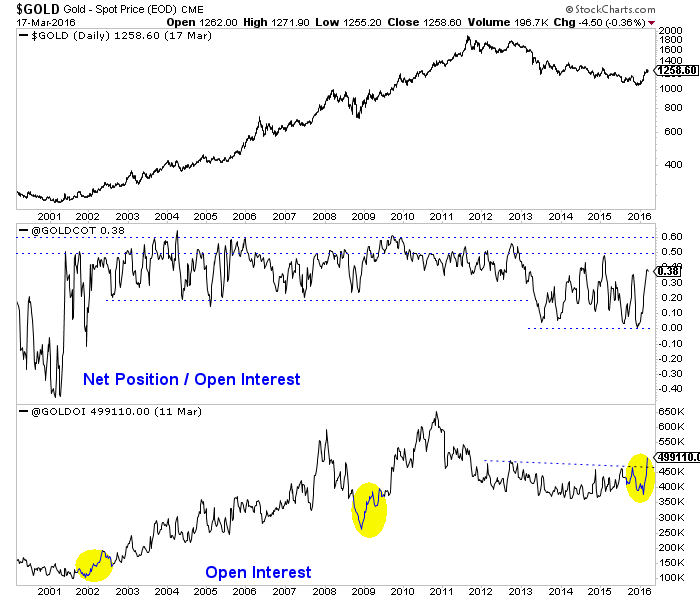
Gold & Gold CoT
Silver is also defying “conventional” CoT analysis. In recent weeks, Silver’s net speculative position of 43% actually was the highest in more than 5 years! That means Silver has to decline, right? While Silver hasn’t broken above $16/oz yet, it closed above its 80-week moving average (by a penny) for the first time since 2012. Moreover, the recent strength in Silver stocks strongly argues that Silver will move higher. Look for an upside target in the mid to high $18s.
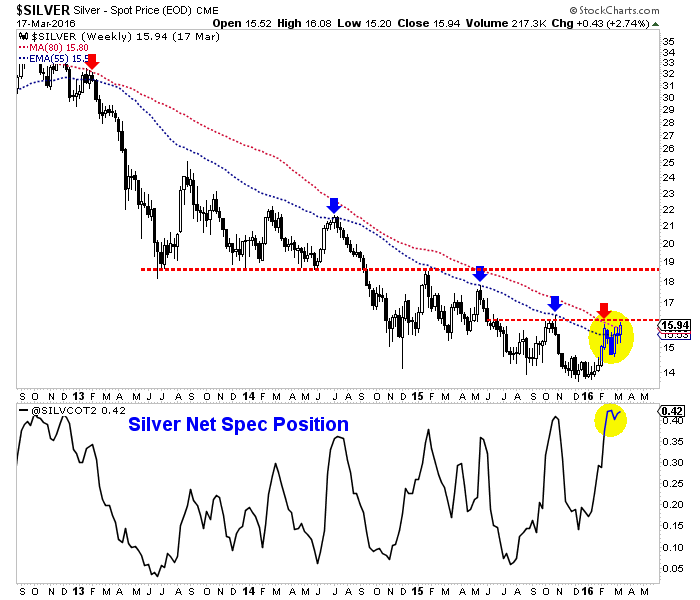
Silver & Silver CoT
There are two problems with the recent, widespread conventional analysis of the CoT. (By the way you can’t swing a dead cat without hitting a “bearish CoT” article or blog post in the past few weeks).
First, bullish and bearish parameters have to adjust during a trend change. In a bear market sentiment usually reaches “extremely bearish” before that market can rebound. Also, even neutral or slightly bullish sentiment is enough to bring about more selling. In a bull market it is the opposite. Sentiment can get really bullish before that market corrects.
The second point is sentiment analysis can be tricky and counterproductive when a market has just made a major trend change. An extreme sentiment reading during a brand new bull trend is often a false signal because the majority remain on the sidelines. This is why new bull markets recover quickly and remain overbought for months amid bullish sentiment.
Here are some examples. Recall the huge moves equities made from the 2002 and 2009 lows. Following its 2002 low the Nasdaq rebounded 94% in 15 months and only endured one real correction (15%). Following its 2009 low the Nasdaq rebounded roughly 100% in 13 months and never corrected more than 9%! Gold, following its 1976 low rebounded roughly 62% over the next 15 months and its worst correction was 11%. Gold from its 2008 low rallied roughly 45% in five months and only endured one 10% correction.
Where are we now?
As we noted last week, if Gold follows the path of the 1976 and 2008 rebounds then it would soon reach $1400/oz and continue to reach higher levels in the months and quarters ahead.
Meanwhile, the gold stocks are certainly overbought but history argues they could trend higher in the months ahead. Note the bull analog chart below. If the HUI follows its 2008 path then it would gain 46% over the next five months and 88% over the next 11 months. If the HUI follows its path after its 2000 bottom then it would rally 128% over the next 16 months.

HUI Bull Analog
While it is very difficult to buy into a market that has already gained substantially, history argues that the larger risk is staying out of that market especially if it only recently made a major bottom. The epic “forever” bear market of 2011-2015 lingers in the minds of many and that is why it is so difficult to believe the recent strength can continue. Hence, many continue to apply bear market thinking and bear market parameters without realizing the sector has made a major character change. That doesn’t preclude the likelihood of pullbacks. We even made a solid case two weeks ago for GDX to correct 20%. It will come to pass soon or later. Going forward, look to accumulate select shares on weakness. Buy and hold. You don’t make money in a bull market by trading.
Jordan Roy-Byrne, CMT


-
I know Mike is a very solid investor and respect his opinions very much. So if he says pay attention to this or that - I will.
~ Dale G.
-
I've started managing my own investments so view Michael's site as a one-stop shop from which to get information and perspectives.
~ Dave E.
-
Michael offers easy reading, honest, common sense information that anyone can use in a practical manner.
~ der_al.
-
A sane voice in a scrambled investment world.
~ Ed R.
Inside Edge Pro Contributors

Greg Weldon

Josef Schachter

Tyler Bollhorn

Ryan Irvine

Paul Beattie

Martin Straith

Patrick Ceresna

Mark Leibovit

James Thorne

Victor Adair