
Gold & Precious Metals
What a move in the gold stocks! The sector has refused to correct for more than a few days at a time. All weakness has been bought as a wall of worry has been built and the sector emerges from a historic low that could be on par with the 1942 low in the stock market. I thought the Federal Reserve statement or reaction to it (along with the market’s overbought condition) might cause the sector to correct this week. Instead, GDX and GDXJ powered higher and have gained roughly 13% for the week.
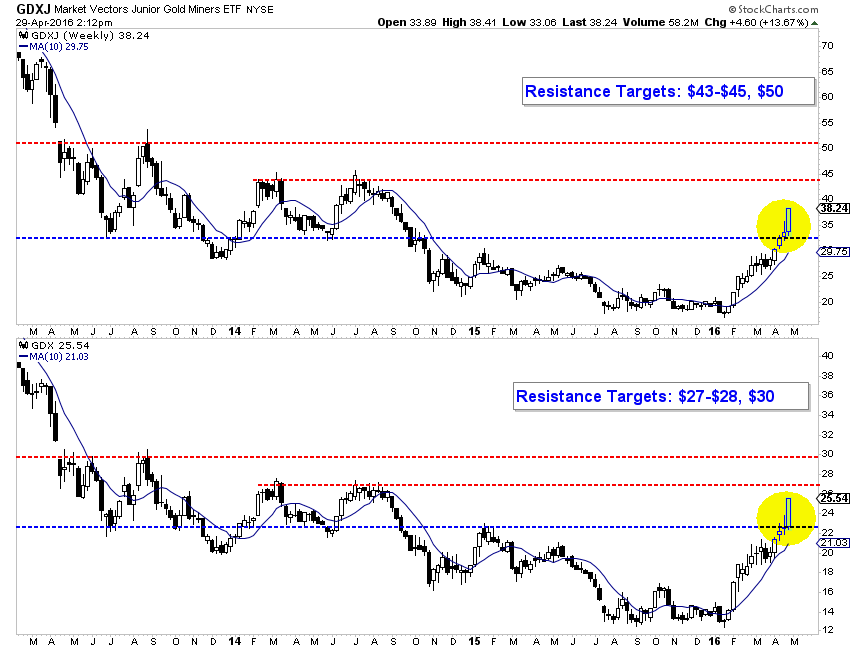
The weekly candle chart (below) shows both GDXJ and GDX are in breakout mode. GDXJ moved beyond previous resistance at $32-$33 and has upside targets at $43-$45 and even $50. Meanwhile, GDX has surpassed resistance at $22-$23 and now has upside to $27-$28 and $30. Furthermore, the 38% retracement of the entire bear in GDX is at $32. Do note that the miners have gapped higher in each of the past two days. For the sake of the bulls on the sideline, I hope to see an immediate pullback in the days ahead.
The gold stocks are already very overbought and if they continue higher unabated then we will have to worry about a potential sizeable correction. The chart below shows GDX’s parent index (GDM) along with two oscillators which plot its distance from its 100-day and 200-day exponential moving averages. The oscillators show the gold stocks are the second most overbought they have been in the past 22 years. The most overbought point was early 2002 when GDM corrected 37% before climbing much higher.
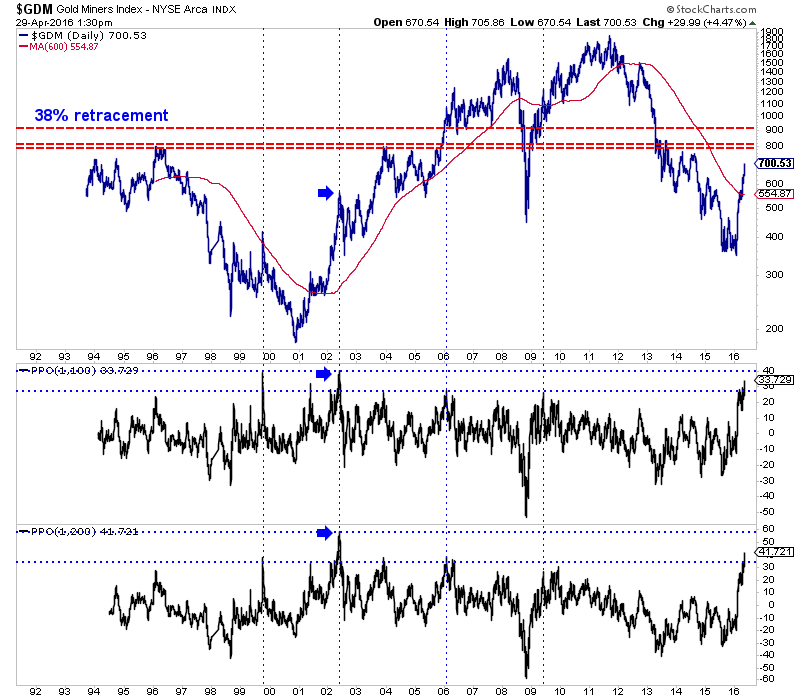
Before we worry about a sizeable correction, let me point out some very important data. The 2002 correction began when GDM and HUI rebounded 212% and 311% respectively from the major low in 2000. Thus far, the two have rallied 100% and 128% respectively.
Furthermore, the gold stocks are only three months removed from what could be the greatest buying opportunity of all time in the sector! While this is a sensational statement, it is rooted in data and facts and not your typical gold bug doomer porn. In short, there are three major similarities between the recent bottom in the gold stocks and the 1942 low in the stock market which arguably proved to be the greatest buying opportunity ever. I discuss and analyze the similarities in this video.
To conclude, the gold stocks have emerged from a historic bottom, have more upside but will eventually correct. How much they correct and when depends on how fast they reach their upside targets and what specific levels they reach. My current guess is anywhere from 25% to 35%.
Jordan Roy-Byrne, CMT
Consider learning more about our premium service including our favorite junior miners which we expect to outperform in 2016.

 Spring is deal season here at MoneyTalks! Mike has decided this is the time of year to make sure his audience get the best offers from our favourite analysts.
Not only has he arranged for you to get a one yearl VICE LETTER subscription for $59 – an 85% discount – you’ll also get Mark Leibovit’s famous Annual Forecast Model for 2016 FOR FREE!
CLICK HERE to get this limited time offer

These are shockingly bad times for big banks, especially when you consider that the overall economy is supposed to be fairly healthy. The latest example is Germany’s Deutsche Bank:
Deutsche Bank Q1 ‘most challenging in several decades’: CFO
(CNBC) – Deutsche Bank posted a 58 percent drop in net profit in the first quarter, to 236 million euros ($267 million) compared to the same period last year.
The group posted a revenue decline of 22 percent year-on-year to 8.1 billion euros which it said “reflected a challenging environment and the impact of strategic decisions to downsize and exit certain businesses.”
In its core business, revenue dropped 15 percent in its corporate and investment banking division and 23 percent in its global markets unit. It said 2016 would be the “peak year for its restructuring efforts.”
Shares of the bank rose 4 percent in early trade on Thursday and the bank’s Chief Financial Officer Marcus Schenck told CNBC that there were highlights among the earnings.
“On the positive side, we made very good progress on implementing further steps on our journey, as in the focusing of the bank, we’re exiting certain countries, we’re exiting certain market positions and all of that is evidenced in a risk-weighted asset position that we have as per the end of the quarter.”
Nonetheless, Schenck conceded that the first quarter had been one of the most difficult in the bank’s recent history.
“I can’t debate away that this has been one of the most challenging quarters over the last several decades,” he said, “(But) we’ve seen the markets calm down a lot in March and April and the performance in those two last months is definitely better.”
Schenck said he had no “crystal ball” to see if the rest of the year would pan out. “There is still a lot of uncertainty out there and there is the ‘Brexit’ question (the U.K. referendum on EU membership in June) and with China, it doesn’t look like there’s going to be a hard landing as some people had feared but still, things can go wrong.”
In the fourth quarter, the bank posted a net loss of 2.1 billion euros and full-year net loss (and a record loss) of 6.8 billion euros in 2015.When that data was released in late January, the chief financial officer Marcus Schenck said he expected 2018 to the first “clean” year for the bank as the lender continued to struggle with writedowns, litigation charges and restructuring costs.
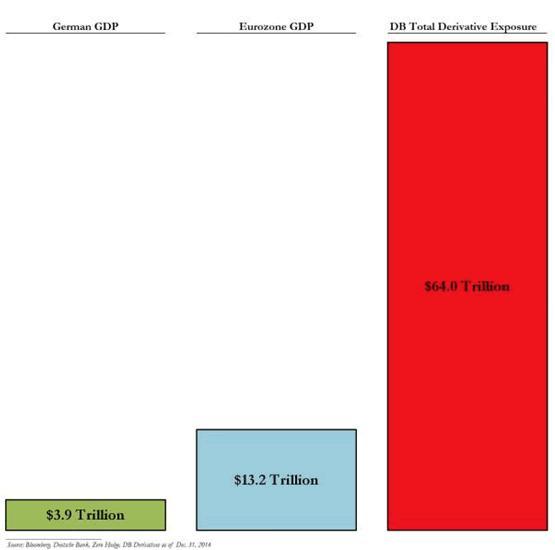
For an entity as big and supposedly diversified as Deutsche Bank to post not just a 58% drop in profits but a 22% decline in revenues is “challenging” indeed. And it draws the eye to the risks these guys have taken on via an over-the-counter derivatives book that is, well, surreal. The following chart originally appeared in a Zero Hedge article.
So the odds that whatever DB management is doing today will fix this mess are pretty slim. Especially if the environment of negative interest rates, zero inflation and slow growth remains in place, as it almost certainly will.
But horrendously badly managed banks are just the tip of the iceberg. Negative interest rates are a mortal threat to all kinds of other financial business models, including insurance companies:
Germany: Where Negative Rates Are Lethal
(Wall Street Journal) – German life insurers are caught in a pinch that could eventually threaten their survival. Regulators are forcing them to boost capital levels at the same time that low rates make it hard to make money with their investments.
The question is how long before the ride gets bumpy enough to shake out the weakest firms.
German regulators are so concerned about the impact of negative interest rates on the country’s life insurers that they have said they can only be sure the sector is safe through 2018. Even today, half the industry would be short of capital without the help of special measures.
The trouble lies in the promises insurers made to policy holders years ago, when nobody would have guessed central banks around the world would send interest rates barreling toward zero, only to remain there for years on end and even break into negative territory.
The German life industry is particularly badly affected by very low or negative interest rates because companies have historically offered what now look like high levels of guaranteed returns over very long periods.
Some insurers need to earn a continuing investment yield of more than 5% to meet guarantees to their policy holders, a report from Germany’s central bank found in 2014. In a world where 10-year German government bonds yield less than one-quarter of 1%, that looks very hard to achieve.
Falling interest rates also increase the size of the liabilities on insurers’ balance sheets, which can reduce their capital if assets don’t increase in valuation enough to match.
Large European insurers such as Allianz SE,AXA SA, Assicurazioni Generali SpA andMunich Re all have big German life businesses, but regulatory concerns are more immediately focused on smaller insurers mainly unknown outside of the country. German life insurers earned gross written premiums of €89.9 billion ($101.4 billion) in 2014, according to the most recent statistics from German financial regulator BaFin.
One thing insurers can’t rely on is a respite on interest rates soon. The European Central Bank is struggling to boost inflation to its desired target, and one of its primary levers is to send interest rates lower. That leaves an open question as to where insurers can find investments with the right combination of yield and risk that will allow them to make good on their promises.
Think of what’s happening in global finance as an environmental change like a drought or temperature shift — that happens too quickly for the ecosystem to adapt. Not every organism dies immediately, but relationships and inter-dependencies are disrupted, killing some and impairing others. Then comes a mass die-off in which a wide range of species disappear.
That, in a nutshell, is what a negative rate world means for banks, insurance companies, money market funds, pension funds, retirees, small savers and pretty much everyone else who depends on substantial risk-free income. The elephants like Deutsche Bank will make a lot of noise when they fall, but for each giant there are hundreds of smaller entities adapted for a very different world and unable to live in this one.
related:
Martin Armstrong: “Draghi is absolutely clueless”


Canadians for Tax Fairness crunched the numbers and found that Canadian corporations invested almost $40 billion last year in the top 10 tax haven destinations for Canadian capital — taking investment totals since 1990 to $270.2 billion.

….for much larger top chart and more analysis go HERE
also:


also: US Dollar Channel of Pain Chart –
US Bonds, Dollar, & Dow Video Analysis
Gold & Silver Bullion Video Analysis
Precious Metal ETFs Video Analysis
Trader Time Swing Trades Video Analysis
SFJ & SF60 Key Stocks Video Analysis
Above are today’s videos and charts (double click to enlarge):
Thanks,
Morris
Morris Hubbartt
trading@superforcesignals.com
trading@superforce60.com
Super Force Precious Metals Video Analysis
posted Apr 29, 2016
The SuperForce Proprietary SURGE index SIGNALS:
25 Surge Index Buy or 25 Surge Index Sell: Solid Power.
50 Surge Index Buy or 50 Surge Index Sell: Stronger Power.
75 Surge Index Buy or 75 Surge Index Sell: Maximum Power.
100 Surge Index Buy or 100 Surge Index Sell: “Over The Top” Power.
Stay alert for our surge signals, sent by email to subscribers, for both the daily charts on Super Force Signals at www.superforcesignals.com and for the 60 minute charts at www.superforce60.com
About Super Force Signals:
Our Surge Index Signals are created thru our proprietary blend of the highest quality technical analysis and many years of successful business building. We are two business owners with excellent synergy. We understand risk and reward. Our subscribers are generally successfully business owners, people like yourself with speculative funds, looking for serious management of your risk and reward in the market.
Frank Johnson: Executive Editor, Macro Risk Manager.dd
Morris Hubbartt: Chief Market Analyst, Trading Risk Specialist.
website: www.superforcesignals.com
email: trading@superforcesignals.com
email: trading@superforce60.com
SFS Web Services
1170 Bay Street, Suite #143
Toronto, Ontario, M5S 2B4
Canada
###
Apr 29, 2016
Morris Hubbartt

-
I know Mike is a very solid investor and respect his opinions very much. So if he says pay attention to this or that - I will.
~ Dale G.
-
I've started managing my own investments so view Michael's site as a one-stop shop from which to get information and perspectives.
~ Dave E.
-
Michael offers easy reading, honest, common sense information that anyone can use in a practical manner.
~ der_al.
-
A sane voice in a scrambled investment world.
~ Ed R.
Inside Edge Pro Contributors

Greg Weldon

Josef Schachter

Tyler Bollhorn

Ryan Irvine

Paul Beattie

Martin Straith

Patrick Ceresna

Mark Leibovit

James Thorne

Victor Adair