
Gold & Precious Metals

There were two back-to-back directional changes for February and March. The computer was dead right AGAIN. February went up, and March went down. Even the Panic Cycle hit on target. On top of that, the decline was a perfect double 8.6 frequency of 17.2 days. Perhaps those who like to try to take shots and say the 8.6 frequency is a bunch of bull, yet offer no empirical evidence to support their claim just opinion, when the Dow Jones Industrials fell for 17.2 months. Gold just fell for 17.2 days.

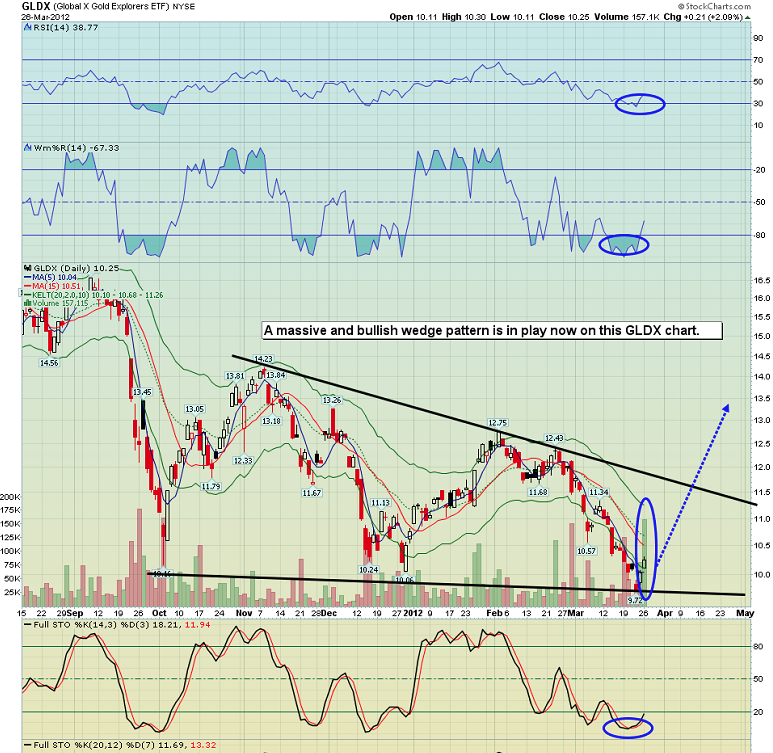
The GLDX chart looks extremely bullish. Almost every indicator and oscillator is flashing light or heavy buy signals, while price itself coils into a fabulous wedge pattern, like a king cobra poised to strike at the hearts of your dollarbug foes!
Mar 27, 2012
Mainstream media tells you that the Dow soared yesterday. Maybe it did, against the dollar. Against gold, the Dow fell. Please click here now. Gold is potentially set to outperform both the dollar and the Dow, in a very big way, in a very short amount of time.
The same is true for silver. I talked yesterday about what I’ve termed the “wedgification” of the gold chart. Wedgification is not a real word. It is a term I coined, like “head and shouldering”, to describe the process where one chart pattern displays fractal-like action, morphing repeatedly into ever-larger patterns of the same type.
A small head and shoulders pattern can become the head of a larger head and shoulders pattern. Likewise, the initial and very bullish gold wedge has just become overpowered by an even larger wedge.
In the case of silver, there is a process going on that I’ve termed “rectangularization”. Please click here now. Note the black supply line that I’ve highlighted at point “A” on the chart.
Now look at point “B”. That’s the price area that was rightfully called a “breakout” by most silver investors. Breakouts should never be bought by anyone other than gamblers. A breakout indicates the potential coming profits on positions already bought at much lower prices.
The breakout at point B was a very positive event for the silver market. Now, make note of point “C”. That’s the point where silver suddenly declined as the bond market began to fall. Now that the silver price has spent some time well below point C, you can draw in a new supply line across that point.
You can now see the “rectangularization” of the silver chart in play, as an even bigger drifting rectangle is now visible on the chart. Bigger price patterns have bigger price targets.
The reason I push the gold community so hard about building emotional strength to manage growing volatility in the gold price is because the upside is so enormous.
In this epic crisis, if you can’t endure gold dropping a few hundred dollars an ounce you’ll likely never make it to the “honeypot zone”.
The t-bond has been put onto the radar screens of most institutional money managers. Rising interest rates can negatively affect gold in the short term. Yesterday, you received some good news, in the form of statements made by Ben Bernanke about the need to maintain “accommodative” monetary policy.
I’m not sure how many investors looked at the bond chart as Dr. Bernanke made those statements, but there was not much in the way of celebration, and that remains a concern. Please click here now. You can see that the bond did not exactly cheer as the head of the Fed spoke.
Note the price resistance in the 139 area on that chart. It’s going to be important to watch how the bond price acts if there is a rally towards 139.
One of the most bearish charts I see in any major market right now is the monthly bond chart. To view a veritable “landslide of sell signals”, please click here now.
How do you, the investor, reconcile the horrific picture on the bond chart against the ultra-bullish picture on the gold chart? You start by strengthening yourself emotionally to deal with the fact that surprise, not prediction, is the theme of this crisis.
Another “chart of horrors” that I’d like you to focus on is the US dollar monthly chart. Please click here now. The 14,3,3 Stochastics series has done a very good job of indicating tops in the dollar, and one such “top call” is in play now.
Bond market players appear to be very negative about the prospects for QE3, while gold market players seem to believe that a collapse in the bond will be quickly followed by an even bigger collapse in the dollar.
The appearance of both the gold and bond charts seem to indicate this is an accurate picture of the “liquidity flows posturing” of the largest major market players.
To view the “gold wedgification” chart, please click here now. Look at how the supply line drawn through high price of point “A” and the demand line combined to create a powerful wedge pattern.
Within the wedge there is head and shouldering action, but the overall picture is that of a wedge, not a head and shoulders pattern.
Now, make note of the supply line drawn through point “B”. Coupled with the same demand line, there is now an even larger wedge pattern in play, which I’ve termed a “super wedge”.
Investors need to understand that the gold price can move hundreds of dollars in either direction and all that movement may do is create an even larger wedge pattern.
Generally speaking, gold stock investors were a little glum yesterday, as once again bullion blasted higher while their stocks mostly meandered or failed to perform. I talked yesterday about the need to be selective in your stock picking.
Please click here now. That is the GLDX-nyse gold juniors fund. Many investors were disappointed that GLDX failed to perform to the degree that GDXJ-nyse did yesterday. Patience is required in a super-crisis, but I think your time to shine is finally here.
The GLDX chart looks extremely bullish. Almost every indicator and oscillator is flashing light or heavy buy signals, while price itself coils into a fabulous wedge pattern, like a king cobra poised to strike at the hearts of your dollarbug foes!
Mar 27, 2012
Stewart Thomson
Graceland Updates
website: www.gracelandupdates.com
email for questions: stewart@gracelandupdates.com” data-mce-href=”mailto:stewart@gracelandupdates.com“>stewart@gracelandupdates.com
email to request the free reports: freereports@gracelandupdates.com” data-mce-href=”mailto:freereports@gracelandupdates.com“>freereports@gracelandupdates.com
Tuesday Mar 27, 2012
Special Offer for 321Gold readers: Send an email to freereports@gracelandupdates.com” data-mce-href=”mailto:freereports@gracelandupdates.com“>freereports@gracelandupdates.com and I’ll send you my free “Batman!” report. I’ll show you the key “Batman” chart pattern in play now on the GDXJ daily chart, and where this pattern indicates prices are likely headed to against the “US dollar joker”!
Graceland Updates Subscription Service: Note we are privacy oriented. We accept cheques. And credit cards thru PayPal only on our website. For your protection we don’t see your credit card information. Only PayPal does.
Subscribe via major credit cards at Graceland Updates – or make checks payable to: “Stewart Thomson” Mail to: Stewart Thomson / 1276 Lakeview Drive / Oakville, Ontario L6H 2M8 / Canada
Stewart Thomson is a retired Merrill Lynch broker. Stewart writes the Graceland Updates daily between 4am-7am. They are sent out around 8am. The newsletter is attractively priced and the format is a unique numbered point form; giving clarity to each point and saving valuable reading time.
We hear calls of market manipulation and intervention and calls to abandon gold stocks and only own physical metal. We heard these calls in 2008-2009 and now we hear them again, which would only prove disastrous for those who heed such advice. The miners are not only extremely oversold but recent price action suggests a bottoming process is beginning.
The struggle of the mining stocks has surprised many including us. We thought record profits and a bullish environment would catapult the miners out of a consolidation and into a major breakout. The perception of an enduring recovery and the endurance and persistence of the wall of worry stage has left the gold stocks unloved and under-owned and for far longer than we expected. We do have to remember that the miners exploded in 2009 and 2010 and it is normal for a bull market to spend months in consolidation. As a result

-
I know Mike is a very solid investor and respect his opinions very much. So if he says pay attention to this or that - I will.
~ Dale G.
-
I've started managing my own investments so view Michael's site as a one-stop shop from which to get information and perspectives.
~ Dave E.
-
Michael offers easy reading, honest, common sense information that anyone can use in a practical manner.
~ der_al.
-
A sane voice in a scrambled investment world.
~ Ed R.
Inside Edge Pro Contributors

Greg Weldon

Josef Schachter

Tyler Bollhorn

Ryan Irvine

Paul Beattie

Martin Straith

Patrick Ceresna

Mark Leibovit

James Thorne

Victor Adair