
Gold & Precious Metals
In Part I of this series, I told you about the five traps that ensnare gold and silver miners, leaving their investors holding the bag.
Now, let me give you the names of the 10 mining companies I wouldn’t touch with a 10-foot pole! If you own their shares or warrants, dump them and don’t look back.
 They’re too heavily indebted … their total cost of production is too high … they’re starting to rehedge their gold and silver reserves and resources … or they’re suffering from a mix of all three.
For reasons I’ve thoroughly documented in my recent online seminars, the next leg of this massive gold market will carry forward into 2016 — another three full years. But to take advantage of it, you must avoid these traps.
You can do that with a nicely diversified portfolio of cream-of-the-crop miners. Let me break them down for you in two categories.
The first category is what I call tried-and-true performers — for your core portfolio. This small, select group of companies includes both rock-solid junior miners with low production costs, good properties, and good management — plus some key senior miners that have successfully avoided the traps most others are now caught in, and that will do well in the months and years ahead.
This core, diversified portfolio includes companies like this senior miner with nearly 19 million ounces of proven gold and nearly 40 million ounces of resources.
At a gold price of $1,250, that’s an asset base of $32.9 billion. What’s more, buying shares in this company gives you great leverage on the price of gold. It’s almost like buying gold at just $175 an ounce — at an 86% discount to today’s gold price.
My three-year target: A 393% gain.
This core portfolio also includes another gem of a miner with a whopping 89 million ounces of gold worth $111.3 billion, giving you even greater leverage. Why? Because buying its shares gives you an interest in its gold reserves at a mere $78 an ounce — a massive 94% discount from today’s already-low gold price.
My three-year price target: A 294% gain.
The second category of mining shares to buy is what I call “high-octane performers.” They are more speculative but still have solid business models.
I’m talking about a select portfolio of junior mining companies with high betas, which means their share prices swing dramatically, opening up multiple trading opportunities. You get in before major rallies, then step aside before intermediate declines — and then do it again, aiming to compound your profits over and over.
Companies like this one, producing silver at roughly $11 an ounce — about 55% of what you’d have to pay to buy silver bullion today — even after factoring in all costs.
Or this junior gold miner, sitting on as much as 19 million ounces of gold at a total ownership and production cost of just $262 an ounce — like buying gold at a 79% discount.
Or a third miner, sitting on as much as 53 million ounces of gold. This company is especially appealing because it doesn’t have to worry about the increasing costs of mining or anything else for that matter. Its primary business model is simply to sit back, let others do the hard work, and collect a stream of overriding royalties.
Also included in this second portfolio should be leveraged mining ETFs, where you can trade a whole basket of mining shares with a simple click of a mouse, getting out near the tops of rallies and getting back in near support.
As you might expect, once you’ve selected the right ones, timing is critical with these shares.
And right now, my timing indicators — the very same indicators that enabled me to call the bottom in gold at $260 back in 2001 and every major move since — are now virtually screaming that we’re about to get a major new “buy” signal in these shares, even before we get a major new buy signal in bullion.
For our first major purchases, I’m eyeing three stocks that, in gold’s first phase up, posted gains of 1,577% … 3,742% … 11,186% respectively.
That’s enough to turn a modest $10,000 investment into $167,700 … $384,200 … or even $1.1 million. Will we be able to catch the exact top and exact bottom of massive moves like these? No. But even if we don’t, we could still be looking at some big-time profits.
Best wishes,
Larry
Posted by Larry Edelson
Related articles:
- Mining Stocks: Fool’s Gold or Diamonds in the Rough?
- Your Ticket to Substantial Profits Ahead
- Mining shares down 63%-78%! What to do …
- Transcript: Gold Stock Disaster or Profit Bonanza?
- Gold Is the Most Hated Investment You Might Want to Love


With gold headed to hopefully its first good up month in the past 10 months (setting aside a small gain in March 2013) it might be time to look at what happened at previous gold lows since the major double bottom lows seen in August 1999 and February 2001.
Besides the major lows of August 1999 and February 2001, other significant lows were seen in May 2005 and October 2008. The 2005 and 2008 lows came following either a lengthy correction or a steep decline. The actual lows were followed a month or at worst two months later by a sharp up month that left bullish engulfing candles on the charts. The up month followed the August 1999 low in September 1999, the February 2001 low in April 2001, the May 2005 low in June 2005 and the October 2008 low in November 2008.
…..read more HERE
Fall in the Prices of Gold & Silver
Gold and silver recently hit their lows –$1,180 for gold and $18.50 for silver—after being hit by tremendous persistent selling from the SPDR gold ETF and then a major, well-engineered bear raid from Goldman Sachs, J.P. Morgan Chase alongside several hedge funds. This entailed the selling of over 1,000 tonnes of physical gold in less than three months. The bear-raid in mid-April involved around 500 tonnes of this. In a market where the net supply is just over 10 tonnes a day, this wave of selling overwhelmed demand, initially and caused the precipitous fall in gold and silver prices.
The falls were attributed to all sorts of factors such as lower growth in China, the U.S. and the rise in interest rates, the potentially better returns in equity markets, etc. With the holders of gold in the SPDR gold ETF mainly U.S. institutions, measured, sad to say, on their short-term performance, the demands to move away from gold (which had stagnated for around 18 months) to equities caused the SPDR selling of around 500 tonnes over the last three months.
But the precipitous fall in mid-April was due to the bear-raid by the banks and hedge funds. They saw gold’s lackluster performance, the steady sales of the shares of the SPDR gold ETF and saw the opportunity. Their motive was simple: profits for the bank and their customers in line with their expressed purpose. We estimate that with the 400 tonnes of short positions on COMEX they raked in around $6 billion in profits at least.
Consequences
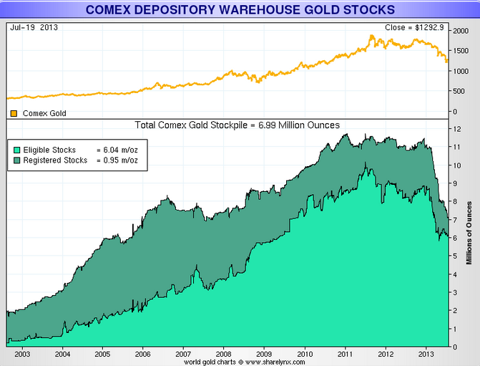
- We know that Goldman Sachs sold off half their warehoused gold in the process as did COMEX both total gold and registered gold, which now stands at 43% of the holding at the beginning of the year.
- We know that the remaining stocks are most likely not available for a similar bear-raid as such a raid would leave the warehouses empty and vulnerable to a default. It is with little surprise that we hear that Goldman Sachs and J.P. Morgan Chase are trying to sell their gold warehouses. The reasons given are that (Goldman’s warehouse company, Metro International LLC, was bought just three years after the investment bank bought the firm for $550 million) a proposed rule change by the London Metal Exchange (LME) to relieve bottlenecks that slow metal delivery out of warehouses could cut into profits for the metal warehouse industry. We expect the Senate committee investigating such operations may have also provided the needed incentive for such a sale?
- We know that the gold holdings of the SPDR gold ETF are down from close to 1,600 tonnes to just over 900 tonnes in the last three months, implying that the long-term holders of these shares remain holders, but short-term performing institutions have sold their holdings. Hence the volumes now available to sell for short-term considerations have now almost gone.
- Total up the above amounts and we see that the bulk of ‘trading gold’ in the U.S. has now been sold off. The only way these can be recovered is if U.S. investors came in as buyers of physical gold.
- We know that despite this huge volume of over 1,000 tonnes sold out of the U.S., Asian and other buyers have absorbed these amounts easily and continue to look for more.
- Thus future U.S. gold investors will have to pay a much higher price to get such volumes back.
- Because the gold price is so low, gold mining companies have to reduce their production and move to higher grades where they can, to retain what’s left of their profitability. New projects are being shelved unless they are of sufficiently high a grade to be profitable at these prices.
- Please note that when ‘cash costs’ are quoted as being needed to continue to keep mining at these prices, they exclude capital expenditure and a return for shareholders. With these in mind, we quote the CEO of Goldfields, in South Africa, as saying that the gold mining industry is not sustainable at prices below $1,500. To continue mining at levels seen before the gold price fell, a higher price is needed to warrant lowering the grades to boost production. Hence newly-mined volumes of gold have dropped with these lower gold prices.
- The source of 35% of gold supply has been from “scrap” or recycled gold. This comes primarily from sales from Asian investors passing their gold to family members and from the recycling of gold jewelry in the developed world. This latter type is expensive to recover because it is usually 9 or 18 carat gold whereas Asian gold is close to pure 24 carat gold. As a result, these lower prices have taken the incentive to sell such gold away, leaving such supplies evaporating. The result to the total gold supply as estimated by the World Gold Council will be a +400 tonne drop in scrap supplies to 1,200 tonnes of the +3,300 tonnes total supply (down from 4,000 tonnes) we will see over the next year. Such a drop in supplies is more than sufficient to cause the gold price to rise on thin volumes. This will happen irrespective of the consequences of any enquiry into the U.S. bank’s behaviour in the gold market and the dangers of default in those markets.
In summary, the enormous fall in available gold supplies has brought the gold market to a point where the shortage of physical supplies, globally, may well prove inadequate to satisfy the demand we are seeing from Asia in the days, weeks and even years to come, unless the gold price moves high enough to bring back scrap sales and greater newly-mined gold production.
Where Now?
The above clearly implies that the gold price should recover to levels from whence it came; however, the loss of U.S. gold holdings removed a potential source of supply at any price level. This alone implies more than just a recovery. It exacerbates the supply shortage considerably. We keep referring to the U.S. as sellers because all the other World Gold Council gold ETFs have remained at constant levels during the last three months, while the U.S.-based SPDR gold ETF has been the main supplier of gold to the market. Should their sales continue in the future, it is clear that, at best, they will simply slow the rise in the gold price!
It is apparent that there now exists an opportunity to hit the gold market with a ‘short squeeze’ by buying physical gold in large amounts to precipitate a quick price rise, particularly because any opposing supplier has already exited the market.
While the major mining companies could well ‘recover’ their share prices, the main beneficiary among the gold miners will be the solid well-managed, well-financed, Junior sector of the gold and silver markets. (See www.GoldForecaster.com &www.SilverForecaster.com list of such mining companies by subscribing.)
Silver
While no such collapse of silver holdings in silver ETFs in the States has taken place, nor was there any bear-raid on the silver price taken place, silver has continued to move with the gold price all the way down and is doing so all the way up. This relationship has been so for many years now, with silver tending to fall further and faster than gold and rising further and faster than gold on the way up. Consequently, this relationship has weathered a major storm. In the future, expect to see silver keep this relationship. So what will happen to gold will happen to silver.
Future of Gold & Silver
All gold investors and institutions are told on a daily basis that the gold price reacts to U.S. economic news. A nuance in the speech of Bernanke has attributed to it a $10 move in the gold price and equivalent in the silver price. While the U.S. is the globe’s most important, wealthy economy and the dollar the global reserve currency the U.S. accounts for less than 10% of the world’s physical demand for gold. With the sell-off of such a large amount of privately held gold in the U.S. in the last three months, it is clear that the influence of the U.S. over the gold price has fallen away considerably lately.
COMEX
Many will retort that the huge volume of derivatives in the gold market, particularly on COMEX, counters that statement. To scotch that belief, we describe a typical hedging operation for which COMEX was designed.
A jeweller decides to order one tonne of gold for delivery in September so he can manufacture jewelry for the festive season at year’s end. This immediately puts him at risk for the period from the time he orders the metal to the time he pays for it, plus the time he takes to manufacture, then sell the jewelry. His business is to make money from the work he puts into the manufacture of the jewelry. He may mark up the price of the gold he uses by a multiple of three times, to reimburse him for his skill and artistry; however, he doesn’t want to speculate on the price of the gold he owns, so he gets rid of that risk by hedging the tonne of gold he uses. So at the time he buys the gold, he sells it on COMEX by selling it ‘forward’ to the time he himself gets paid at the end of the year.
He now has two positions, which match. But if we go back to April’s end we see that the price of gold fell by $200, so while he appears to have lost on his ‘physical position’ he has gained on the sale in the futures/options market by $200. You would think that would be the end of it, but no, usually he takes a view on the gold price at that point and would leave his original long position un-hedged
So he now has a $200 profit on his COMEX position and remains exposed to his ‘natural’ long physical position again.
Then the gold price recovers to the price he originally paid for the gold. It now pays him to sell one tonne again removing the price risk once more. He now has $200 in hand and a closed position hedged once more by a short position on COMEX and no price risk. It is as though he bought his gold at the ‘bottom’ raising his profits when he eventually sells the jewelry at year’s end.
In summary, he has handled one tonne of physical gold and two tonnes of ‘financial gold’ in the paper market. This has been a simplified exercise, but often the Commercials trade such a ‘natural’ position up to 50 times or more using the same original physical gold. A professional trader will do such an exercise many more tomes. If he can harness high speed trading he can multiply that number many, many times creating what seems to be huge positions in gold both long and short. But because they are set against each other the net position is actually tiny, because the vast majority of trades result in no physical movement of gold at all. So rare is the requirement to move physical gold that COMEX requires any trader/speculator to notify them and the counterparty in writing if they intend to take delivery of physical gold.
Such transactions, unsurprisingly, account for less than 5% of all COMEX’ transactions.
The conclusion is that all financial transactions in gold shares and 95% of COMEX transactions involve the buying of zero physical gold whatsoever. These ‘gold’ transactions are actually, ‘full of sound and fury, signifying nothing’ to the gold price.
Asia
By contrast Asian transactions in gold involve not short of 100% physical gold. Hence Asia accounts for around 70% – 80% of the world’s physical gold today.
With the growth and enrichment of Asians over time this percentage is bound to grow.
New World for Gold
Add to this the change in the global monetary system from a dollar hegemony to a multi-currency system with all its uncertainties and the continuing desire on the part of emerging nation’s central banks to increase their gold holdings, and you have a very different gold market in the years ahead, to the one we have seen in the last three months!
Hold your gold in such a way that governments and banks can’t seize it!
Enquire @ admin@StockbridgeMgMt.com
Get it First. Subscribe @
Previous Articles by Julian D. W. Phillips, Gold/Silver Forecaster – Global Watch
Legal Notice / Disclaimer
This document is not and should not be construed as an offer to sell or the solicitation of an offer to purchase or subscribe for any investment. Gold Forecaster – Global Watch / Julian D. W. Phillips / Peter Spina, have based this document on information obtained from sources it believes to be reliable but which it has not independently verified; Gold Forecaster – Global Watch / Julian D. W. Phillips / Peter Spina make no guarantee, representation or warranty and accepts no responsibility or liability as to its accuracy or completeness. Expressions of opinion are those of Gold Forecaster – Global Watch / Julian D. W. Phillips / Peter Spina only and are subject to change without notice. Gold Forecaster – Global Watch / Julian D. W. Phillips / Peter Spina assume no warranty, liability or guarantee for the current relevance, correctness or completeness of any information provided within this Report and will not be held liable for the consequence of reliance upon any opinion or statement contained herein or any omission. Furthermore, we assume no liability for any direct or indirect loss or damage or, in particular, for lost profit, which you may incur as a result of the use and existence of the information, provided within this Report.
— Posted Thursday, 25 July 2013

-
I know Mike is a very solid investor and respect his opinions very much. So if he says pay attention to this or that - I will.
~ Dale G.
-
I've started managing my own investments so view Michael's site as a one-stop shop from which to get information and perspectives.
~ Dave E.
-
Michael offers easy reading, honest, common sense information that anyone can use in a practical manner.
~ der_al.
-
A sane voice in a scrambled investment world.
~ Ed R.
Inside Edge Pro Contributors

Greg Weldon

Josef Schachter

Tyler Bollhorn

Ryan Irvine

Paul Beattie

Martin Straith

Patrick Ceresna

Mark Leibovit

James Thorne

Victor Adair