Gold & Precious Metals

Swiss gold fund manager Egon von Greyerz tells King World News today that Swiss banks are obstructing their clients trying to remove gold to private vaults. Von Greyerz adds that gold’s downtrend is over and its uptrend will accelerate soon. The World Is Now On The Edge Of A Massive Collapse Egon von Greyerz warned King World News that the world is now on the edge of a massive collapse. Geryerz also cautioned investors that banks are now making it harder for their clients to get physical gold out of the banking system.

Australia’s ANZ bank is the latest to open a gold vault in the Singapore Freeport area next to the city state’s Changi airport. Other recent vault builders there include Deutsche Bank and JP Morgan, while Switzerland’s Metalor has one under construction and due to open in a couple of month’s time. Together with new gold vault openings in Hong Kong this is yet another outward sign of the continued flight of gold from West to East, although the vaults are also servicing western precious metals investors seeking safe, and relatively low cost vaulting facilities outside of the traditional depositories in the U.S. and Europe. Now either the Western bullion banks have misjudged the power that gold still retains in the global psyche and as a key financial instrument, or the Asian investors and governments, which are continuing to accumulate gold at a high rate, have got it wrong.


http://www.gata.org

Martin Armstrong’s GOLD OUTLOOK

NGCFOR-W-8-13-2013

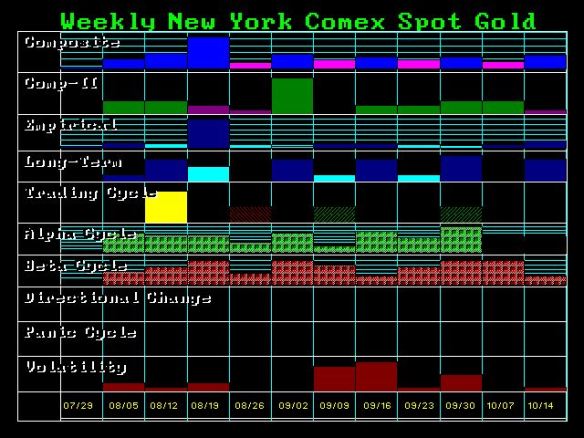
The diehard bulls are already proclaiming the low is in place so buy – buy – buy. Gold should press higher into next week, but the Weekly Bullish Reversal stands at 1423 and the year-end resistance will be 1435. The big turning point is still next January. So we are about $100 below major resistance. This diehard bullishness swearing every time this is it, is perhaps what has to break before we get the real bull market. Gold never got through the 1980 high adjusted for inflation $2300. It has been the worst performing asset with equity and, real estate advancing far more. The Dow stood at 1,000 in 1980 when gold was $875. The Dow has come close to 16,000 and gold could not break $2,000. It is all about time. You cannot have gold blasting up and everything else is not in line. But again, these people only look at gold and ignore the rest of the markets.

The time will be right. But patience is necessary. The problem with the Goldbugs is they are just always bullish and by constantly talking the same game no matter what, real unbiased investors get turned-off. This damages the credibility of the metals and makes a lot of people look at them as a joke rather than an asset class. It would be if a stock broker constantly said buy – buy – buy, even when the Dow declines.

Gold Stocks are Leaving the Station

All aboard and back up the truck. The recovery train is soon to leave the station for higher prices!

Obviously, the ideal time for that would have been at the exact bottom. Hours before that bottom we penned an article titled, Epic Opportunity in Gold Stocks. A number of factors came together making a near bulletproof case for a major bottom. Bulletproof is a dangerous word to use and especially for someone (cough, me!) who had anticipated a huge rebound as early as the spring. Last week we used that term again because the gold stocks were only correcting and consolidating which is a typical of a post-bottom rebound. The precious metals complex looked weak to start last week but reversed course to form not only a bullish weekly reversal but the first higher low since the major bottom. Our technical work and historical analysis strongly argue that it’s only a matter of time before this sector begins the next move higher.

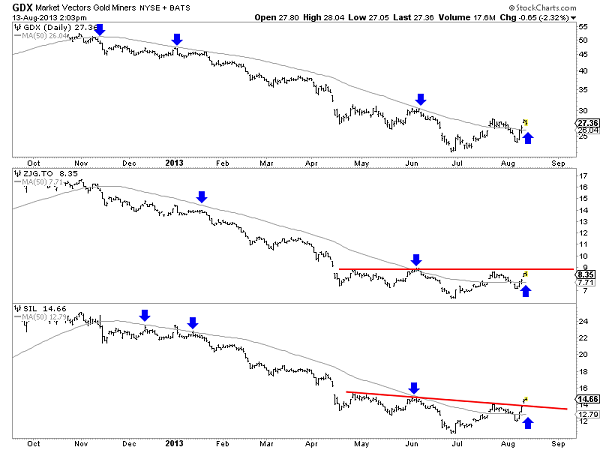
The daily chart below shows GDX (large miners), ZJG.to (mid-tiers and juniors) and SIL (silver stocks). All markets have not only put in a higher low but are now trading above their now upward sloping 50-day moving averages. In studying the 1970, 1976, 2000 and 2008 bottoms in gold stocks I found that the recoveries accelerated after the market moved above a flat or upward sloping 50-day moving average. That is currently quite visible in ZJG and SIL. GDX contains the large and most depressed companies so its not a surprise that its lagging. These markets should soon break out from their multi-month bottoming patterns.

aug13edminersetfs

The next chart shows the current recovery (blue) overlaid with the average recovery which I constructed by amalgamating the 1970, 1976, 2000 and 2008 recoveries. We shouldn’t expect the current recovery to mirror the average exactly. The projection (average) serves only as a guide but that guide is telling us that big gains could be directly ahead. 

aug13edprojhui

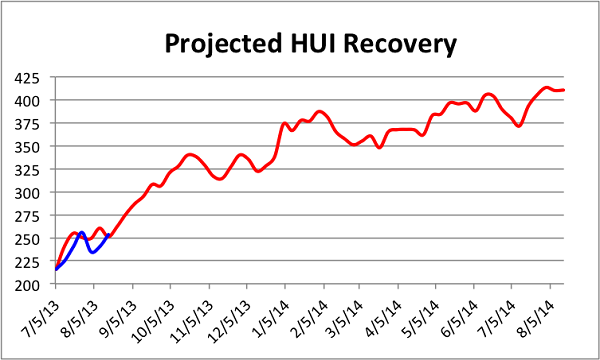
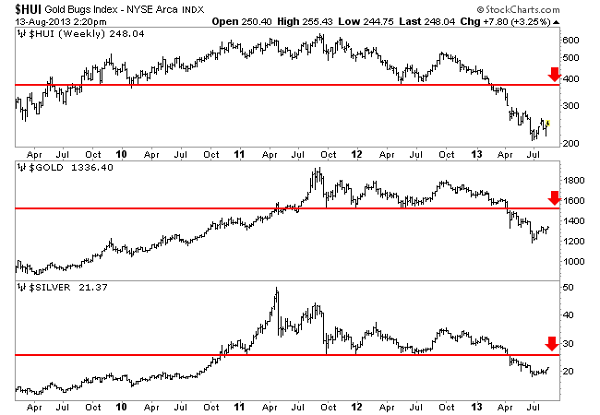
The projection above shows the HUI reaching 340 quickly and then 385 a few months later. The weekly chart below shows the next major resistance for the HUI, Gold and Silver. The HUI won’t face major resistance until 365 to 375. Thus, there is ample room for the market to recover as shown in the above projection. The same can be said of Gold and Silver. If and when Gold breaks $1350 it should have little in its way until $1525. Meanwhile, Silver should be able to rally back to $26.

aug13edgldslvhui

It’s true of any market but even more so for the precious metals complex. The biggest gains come immediately following major bottoms. The recovery template shows that the recovery and gains really accelerate after the first correction or consolidation. Last week this sector put in a higher low on the weekly chart. That is significant. Look for this sector to gain momentum in the coming days and weeks. More instructive is the fact that many quality and leading companies are already trading at three or four month highs. Most traders will go with GDX and GDXJ, thereby neglecting the fact that there are huge gains to be had in this sector if you can identify the leading companies. For those who missed the initial rebound, now could be your final chance to initiate or add to positions before the acceleration begins. If you’d be interested in our analysis on the companies poised to lead the next bull market, we invite you to learn more about our service.

Good Luck!

Jordan Roy-Byrne, CMT

http://thedailygold.com

Jordan@TheDailyGold.com

I’ll tell you the one thing that has changed:  The price of silver has gone down.  That means that it’s even more of a screaming buy than it was back in 2011.  If that’s not enough (and it probably shouldn’t be), here’s some more for you (in case you’ve forgotten):

  • The demand for silver is high and growing every day; at the same time silver stockpiles are being depleted and there is much talk about an imminent financial and industrial silver shortage
  • Silver is a very small market; when a few “big players” get involved, price will move rapidly upwards
  • Silver typically follows gold;  and the fundamentals for gold are outstanding right now
  • Many countries around the world, including China and India, are importing large quantities of silver and gold
  • The silver/gold ratio is abnormally high (~60:1); it’s more traditional level is more like 15:1.  That means that silver is probably a much better investment compared to gold right now.  (But they’re both going to go up!)
  • Many silver analysts are claiming that the bottom is in for this correction.  Many claim that the next stop is in the $60 range; after that comes the $100 range.  Some even claim that if our government keeps printing $85 billion every month, we may even see four-figure silver.

….read the entire article HERE

  1. The technical outlook for gold, silver, and mining companies continues to improve. Please click here now . That’s the daily gold chart, and it looks excellent.
  2. First, note the position of my stokeillator (14,7,7 Stochastics series), at the bottom of the chart. The lines are touching, and close to generating a key buy signal.
  3. Furthermore, this potential buy signal is occurring with the lead line near the 50 level, which is where powerful momentum-based price rallies can begin.
  4. Note the action of the moving averages (MA). For intermediate term moves, I like to focus on the 50,5 MA series. A moving average sell signal occurred last fall, with gold trading near $1700.
  5. Finally, over the past two days, a moving average buy signal has been generated.
  6. There is powerful sell-side HSR (horizontal support & resistance) in the $1320 – $1350 area, but these technical buy signals are beginning to attract the attention of analysts at major banks. The technical “fuel” to move gold above $1350 is now in the market.
  7. Silver is a particularly interesting commodity right now. The April & June declines took silver below where it was trading before quantitative easing began.
  8. The Fed has been very clear that it remains committed to stimulus and to a low interest rate environment. In my professional opinion, the price of silver should not be trading now, below where it was when QE started. I think silver traders overreacted to “taper time” talk, and a sizable rally is very likely.    
  9. Please click here now . You are looking at the daily chart for silver. My stokeillator is flashing a strong buy signal, and so is the 50,5 MA (moving average series). 
  10. Silver and gold stocks can be good leading indicators for the gold price. Over the past two days, silver has traded well above its July highs. 
  11. The July highs in the $20.50 area have now become buy-side HSR.Momentum-oriented traders will likely be taking note of the improving technical situation for silver, and placing buy orders.
  12. There is no free ride in markets, and gold is no exception to that rule. Please click here now . That’s a daily chart of the US dollar versus the Indian rupee. Unfortunately, the dollar has surged to another new high.
  13. India’s government and central bank have enacted very tough gold import rules, to combat the strength of the dollar, but so far, that’s not working. 
  14. The Indian government blames gold imports for the CAD (current account deficit), because gold is bought with US dollars rather than with rupees. There are rumours that stronger rules are coming, and those rules could also extend to the silver market, to prevent substitution.
  15. I think it will take about a year for the Indian current account deficit to stabilize. QE tapering is likely already factored into the gold price by most institutional traders, so the rupee chart is the only really negative factor that I see for gold, at least for the next few months. In the intermediate term, the bulls seem ready to dominate the bears.
  16. The daily T-bond chart is slightly concerning, but only on a very short term basis. Please click here now . That’s the daily T-bond chart. I don’t think Ben Bernanke has “lost control” of the bond market at all. If he had lost control, the dollar wouldn’t be drifting lower. It would be crashing. Bonds would also be crashing, and that’s not happening.
  17. Take note of the 136 level on the T-bond chart. If bond prices can move above that, it could help gold surge towards $1400. The T-bond stokeillator looks good, and the stock market is entering “crash season” (September – October), after a multi-year advance that has attracted a number of retail investors. 
  18. A bond market rally is very probable in this environment, as “smart money” institutional managers look to lock in stock market profits. 
  19. There’s more good news for commodity bulls. Reuters News reports this morning that China’s gold buying exceeded 700 tons in the first six months of the year, which is an increase of about 50% over last year. 
     
  20. Also, the nation recently stunned most analysts, with the release of commodity demand statistics for July. Instead of falling, Chinese demand for oil went to an all-time high. 
  21. Clearly, the industrialization of China continues, and that’s great news for commodity investors.
  22. Please click here now . That’s the GDXJ daily chart, and it’s arguably the most exciting chart in the metals sector right now. Since the highs in the $100 area occurred last September, no GDXJ rally could exceed a previous minor trend high. That situation changed yesterday, with the move to $45. Good volume accompanied the price surge. The red downtrend line has been penetrated, which is bullish.
  23. A lot of investors are looking for “the bottom” in gold stocks. Unfortunately, I don’t think that’s a very profitable approach to the market. A rally seems likely here, and it’s arguably already underway, but as 2014 (and real QE tapering) approaches, bank analysts could turn very negative on commodities, and particularly on gold.
  24. It’s very dangerous to assume that precious metal assets will never trade below certain levels in your lifetime. From their recent lows, many junior gold stocks are already up 50% – 100%. Professional investors are booking profits now, while amateurs begin to draw arrows to price targets that are surreal, but emotionally satisfying. If you were able to buy into the recent gold stock carnage, even in a tiny way, it’s important to have a profit-booking mindset now, as price goes higher!

Aug 13, 2013
Stewart Thomson
Graceland Updates
website: www.gracelandupdates.com
email for questions: stewart@gracelandupdates.com 
email to request the free reports: freereports@gracelandupdates.com

Graceland Updates Subscription Service: Note we are privacy oriented. We accept cheques. And credit cards thru PayPal only on our website. For your protection we don’t see your credit card information. Only PayPal does.

Subscribe via major credit cards at Graceland Updates – or make checks payable to: “Stewart Thomson” Mail to: Stewart Thomson / 1276 Lakeview Drive / Oakville, Ontario L6H 2M8 / Canada