
Gold & Precious Metals
Dollar Rallies, Gold Declines
In short: In our opinion short positions (half): gold, silver, and mining stocks are justified from the risk/reward perspective.
The entire precious metals sector declined yesterday, even gold. Has the situation changed enough to double the short position? Let’s take a closer look (charts courtesy ofhttp://stockcharts.com).

Miners once again moved lower by more than 1% and the volume – while still not huge – was higher than on the previous day. Increasing volume during a downswing is a bearish sign, especially that the day before the decline started we had seen a move up on tiny volume.
Miners moved below the October 2013 high, but they did not move below their previous local low (the most recent one) and back below the 50% Fibonacci retracement level. The situation is bearish, but it doesn’t look that it deteriorated. (click chart for larger view)

Gold moved lower on relatively high volume, which is a bearish sign. We also saw another sell signal from the RSI and Stochastic indicators. The situation on the above chart has clearly deteriorated, but the move lower has not been significant enough yet to make the situation extremely bearish. (click chart for larger view)

Yesterday, we wrote the following about the Euro Index:
The situation on the currency markets remains unchanged. The Euro Index is likely to decline based i.a. on the long-term declining resistance line that was recently reached, but not broken.
Even if we had assumed that there was a small breakout above the declining resistance line, it would have been invalidated yesterday. The short- and medium-term implications are bearish for the Euro Index and for the precious metals market. They will become stronger if we see continuation of the decline in the former.

As one might have expected, a decline in the Euro Index meant a move higher in the USD Index. That’s not a surprise as the US Dollar was right at the medium-term support line and was likely to move higher once again shortly. Quoting Tuesday’s alert:
The medium-term USD Index chart suggests that we are still likely to see much higher USD values. The index is right at the long-term (or medium-term depending on one’s approach) support line and after a breakout. It’s an index just waiting to start a big rally. A rally in the USD Index to the 85 level or so would likely have a devastating effect on the precious metals market and this type of rally could be seen based on the above chart.

If the USD really rallies and gold refuses to decline, then we will be happy to conclude that the medium-term decline in the precious metals market is probably over. It simply doesn’t seem to be the case just yet.
The above remains up-to-date. (click chart for larger view)

In Monday’s alert we commented extensively on the juniors’ outperformance and its implications. We summarized that it was not necessarily a bullish sign and that the last 4 years’ performance suggested that we were approaching a local top. We also wrote that the sell signal from the Stochastic indicator would be an important event – we wrote that a sell signal from Stochastic could actually trigger a decline on its own in the current state of the market.
We have just seen this signal, so the situation has further deteriorated from this perspective. (click chart for larger view)
Last but not the least, we would like to discuss the situation in the silver market. We previously wrote about the 50-week moving average that was likely to keep the rally in check. Yesterday, silver invalidated a small, unconfirmed breakout above this resistance and at the same time moved back below the 2008 high. The bearish implications of these events will be much stronger if silver closes the week below these levels, but the outlook deteriorated somewhat based on yesterday’s price action anyway.
Also, please note that the volume is already quite significant for this week even though only 3 trading days have passed. Silver is declining this week, so this is a bearish indication.
All in all, we can summarize the situation by writing once again what we wrote yesterday:with the currency market being a major (!) threat to the precious metals market’s rally and indications that this market will move lower at least in the short run, we think the short positions are justified. The situation has deteriorated somewhat based on several signals, but it doesn’t seem to become extreme enough to justify doubling the short positions just yet.
To summarize once again:
Trading capital (our opinion): Short position (half): gold, silver, and mining stocks.
Stop-loss details:
– Gold: $1,366
– Silver: $22.60
– GDX ETF: $28.9
Long-term capital (our opinion): No positions
Insurance capital (our opinion): Full position
Please note that we have started to include the insurance capital on the above list in order to avoid the impression that we suggest being entirely out of the precious metals market. Those of you who have been with us for a long time are well aware of this, but since a lot of new subscribers have joined us recently, we though a quick reminder should be useful.
We have expressed our opinion regarding being out with one’s long-term investment capital, but being in as far as the insurance capital (physical precious metals holdings) is concerned. You will find details on our thoughts on gold portfolio structuring in the Key Insights section, but in short, it depends on your approach and experience. Below you will find a “portfolio” that we created for Eric – the fictional character that we use to illustrate suggestions (not investment recommendations) for beginning investors. More precisely, this was the portfolio before we suggested moving out of the precious metals market (so, before April 2013). (Chart link didn’t work, will try and find it – Ed.)

Now the “investment” category would be 0%, but the insurance remains at 44.1%. Please note that the average size for the trading position (we provide the netted amount in the above points regarding positions / trades) is just 1.4% of the entire capital in this case, so half of the position means using just 0.7% (11.8% is kept in cash / dedicated to trading but only a part of it is used for each trade). The entire portfolio report provides also 2 other fictional characters and their “portfolios”. John being the proxy for an experienced investor is the other extreme (Eric being the beginner). He “has” 17.6% in insurance capital and the average size of his trading position is 31.6% (half of which is 15.8%).
The bottom line is that if you assume that precious metals have much further to go (beyond 2011 highs) like we do, having just some money in the sector might appear as being out – and opening a small speculative short position in addition to it might seem as betting against it. When one looks at it from a “fresh perspective” without any assumptions about the gold bull and reads about shorting, they might get the impression that we suggest being entirely out of the market, which is not the case. Actually, the netted effect of small speculative short positions is simply hedging the insurance capital to a smaller or greater extent. It might be more than that if we suggest doubling the size of the short position, but that’s not the case just yet. Of course the above is not an investment advice and consulting an investment advisor before taking action regarding your portfolio is encouraged.
As always, we’ll keep our subscribers updated should our views on the market change. We will continue to send them our Gold & Silver Trading Alerts on each trading day and we will send additional ones whenever appropriate. If you’d like to receive them, please subscribe today.
Thank you.
Przemyslaw Radomski, CFA
Founder, Editor-in-chief
Tools for Effective Gold & Silver Investments – SunshineProfits.com
Tools für Effektives Gold- und Silber-Investment – SunshineProfits.DE
* * * * *
Disclaimer
All essays, research and information found above represent analyses and opinions of Przemyslaw Radomski, CFA and Sunshine Profits’ associates only. As such, it may prove wrong and be a subject to change without notice. Opinions and analyses were based on data available to authors of respective essays at the time of writing. Although the information provided above is based on careful research and sources that are believed to be accurate, Przemyslaw Radomski, CFA and his associates do not guarantee the accuracy or thoroughness of the data or information reported. The opinions published above are neither an offer nor a recommendation to purchase or sell any securities. Mr. Radomski is not a Registered Securities Advisor. By reading Przemyslaw Radomski’s, CFA reports you fully agree that he will not be held responsible or liable for any decisions you make regarding any information provided in these reports. Investing, trading and speculation in any financial markets may involve high risk of loss. Przemyslaw Radomski, CFA, Sunshine Profits’ employees and affiliates as well as members of their families may have a short or long position in any securities, including those mentioned in any of the reports or essays, and may make additional purchases and/or sales of those securities without notice.

This week two investment firms came out expressing their disbelief that silver has any more upside, so investors may start getting nervous and begin asking the same question.

….click on image to view a larger chart and read more HERE


The key resistance in gold on a nearest futures basis stands at the 1400 zone on a technical basis the weekly level. On our model, A Daily Bullish Reversal stands at 1344 nearby while on the weekly level the major barrier overhead remains at the 1420-1425 level. Of course, the gold promoters always proclaim a bull market and quickly forget every decline. Often they seem just like politicians always preaching their own self-interests with little regard for the financial survival of their victims. They act as if you will miss the ENTIREbull market unless you buy immediately today.
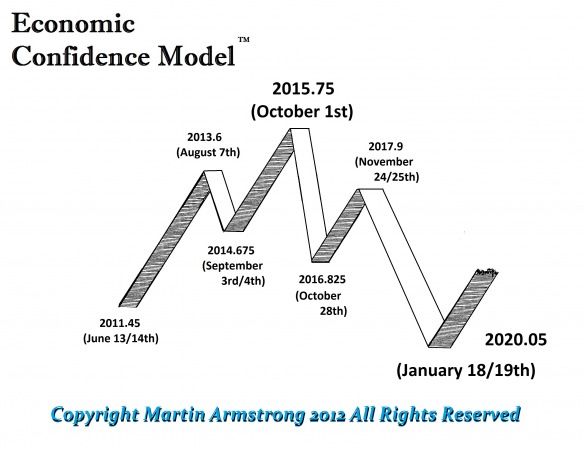
Timing wise, it still looks like the major SUSTAINABLE rally comes AFTER the turn in the ECM 2015.75. From a broader perspective, we really want to see a low with the top of the ECM into early 2016 for that would set the stage for a serious rally thereafter that may at last really breakout above the 1980 high in real terms – not simply nominal terms.
However, the gold promoters never look at the long-term and how the market plays a role within the entire global perspective. The crisis in Ukraine and the LIKELIHOOD that we will see Russian intervention can cause a spike rally in gold. We are not going to be out of the woods on this crisis at least until the after the week of April 7th. That seems to be the real target in time.
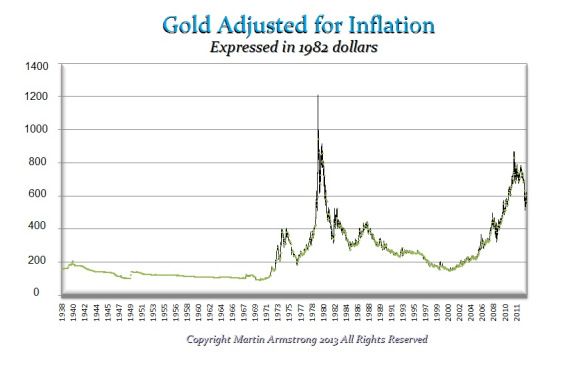
Gold will not look impressive unless we see it exceed the 1425 level on a Weekly Closing Basis. Remaining beneath that level into April only warns that we can still see new lows into next year before the whole thing goes nuts starting in 2016. Keep in mind that a crisis in Ukraine with a Russian invasion will send the dollar higher. Russia is already saying the overthrow of the Viktor Yanukovych was illegal despite the fact the people did so in great mass without ANY weapons from the West. The future rally we see for gold hasNOTHING to do with hyperinflation, the Fed or other nonsense. This is now in the hands of geopolitical uncertainty and that is where gold comes in – it is as I have always stated – a hedge against governments not inflation as clearly demonstrated with the above chart.
also:
US Military Spending Bottoming with the Cycle of War low – Amazing

-
I know Mike is a very solid investor and respect his opinions very much. So if he says pay attention to this or that - I will.
~ Dale G.
-
I've started managing my own investments so view Michael's site as a one-stop shop from which to get information and perspectives.
~ Dave E.
-
Michael offers easy reading, honest, common sense information that anyone can use in a practical manner.
~ der_al.
-
A sane voice in a scrambled investment world.
~ Ed R.
Inside Edge Pro Contributors

Greg Weldon

Josef Schachter

Tyler Bollhorn

Ryan Irvine

Paul Beattie

Martin Straith

Patrick Ceresna

Mark Leibovit

James Thorne

Victor Adair