Currency
Ever critical for the value of investments in different currencies, the US Dollar is down again today for the third day in a row. Jack Crook’s forecast of the major currency pairs has been very accurate to date, and this analysis will tell you where you can expect the US Dollar, Euro, CDN Dollar, Japanese Yen Australian Dollar and the Great British Pound will be headed next. – R. Zurrer for Money Talks
US Dollar Index
Update: 8 April 2018/4:03 am ET
Price at update: 90.11
Wave Description: (i)|[v]|5 final thrust lower
Price Target: 87.27
Resistance: 90.98|92.40
Support: 89.82| 88.25
Forecast Negation: 92.98
Wave Analysis
Is Wave [iv]’s maddening triangle pattern finally complete? Did we see a near-term reversal pattern on Friday? We are working from the premise of yes and yes; and it is why we got long EUR/USD. Targeting down to at least 87.27 in Wave [v].
EUR/USD Daily
Update: 8 April 2018/4:03 pm ET
Price at update: 1.2281
Wave Description: (i)|[i]|5 impulse rally
Price Target: 1.2623
Resistance: 1.2623 1.2344
Support: 1.2476 1.2153
Forecast Negation: 1.1960
Wave Analysis
Working off the premise that wave [iv] complex triangle pattern is complete with the bullish engulfing reversal pattern on Friday. (Note last two recent bullish engulfing patterns spiked out short-term bottom—each followed by an approximate 300 pip bounce.) We have revised our price target to 1.2623 based on confluence extension of Wave [i] by 1.618 and Wave [v] equality with Wave [1]—both carry exactly to 1.2623 (our minimum target). There is scope to go higher: targets above 1.2623 are 1.2779; then 1.2876.
USD/CAD Daily
Update: 8 April 2018/4:03 pm ET
Price at update: 1.2769
Wave Description: B/(C)/[2] Zig Zag
Price Target: 1.2496 (then 1.3424)
Resistance: 1.2943|1.3128|0.7916
Support: 1.22729 | 1.2581|1.2445
Forecast Negation: 1.3124
Wave Analysis
Another zig zag pattern seems in play here- A-B-C targeting eventually to 1.3424 to complete major wave (C) of [2]. But in the meantime, we are expecting a push down to 1.2496-level in minor [c] to complete Wave B. Note the head and shoulders setup in this chart; the neckline was broken today and the price target of 1.2496 is based on the that pattern.
USD/JPY Daily
Update: 8 April 2018/4:03 pm ET
Price at update: 106.79
Wave Description: [iv]|5|(1) impulse rally
Price Target: 103.39
Resistance: 107.49/ 107.90
Support: 104.55|103.3 9
Forecast Negation: 110.83
Wave Analysis
We were thinking Wave [iv] of a narrowing triangle pattern was complete, but it seems there is more to go. But, this is a very complex correction to confidence on exactly how this plays out is murky still. Either way we do believe this move down targets to at least 103.39 in a final Wave [v] of 5 of (1); after that a multi-month rally should resume.

*Note, if you are interested in the Great British Pound and/or the Australian Dollar for the same analysis go HERE


The attack on cryptocurrencies by centralized financial institutions in the name of “protecting investors from volatility” continues. Last week one of Canada’s largest banks blocked cryptocurrency purchases, a move that followed similar bans in the United States by large banks like JP Morgan. The Reserve Bank of India has issued a blanket ban on all cryptocurrency trading:
You will not be able to buy cryptocurrency via banks or e-wallets etc. in India anymore as Reserve Bank of India (RBI) has banned them with immediate effect from “dealing with or providing services to any individuals or business entities dealing with or settling virtual currencies”.
Whether it was the moves by Central Banks or that is just the excuse, a quick glance at these charts reveals the current state of the Crypto market – R. Zurrer for Money Talks
New Weekly Update: The Three Largest Cryptocurrencies
With all the focus on bitcoin lately, we’ve added a new weekly update that tracks the three largest cryptocurrencies by market share: bitcoin, Ether, and Ripple. According to Wikipedia, a cryptocurrency is “a digital asset designed to work as a medium of exchange that uses cryptography to secure its transactions, to control the creation of additional units, and to verify the transfer of assets.”
Bitcoin is the world’s first cryptocurrency and decentralized digital currency. The first bitcoin transaction occurred in early 2009 and has since grown worldwide. Ether is another cryptocurrency run on the Ethereum blockchain platform and has the second largest market share, despite being the newest of the three with its launch in July 2015. The third largest market share of cryptocurrency, XRP, is owned by Ripple and launched in 2012.
Here are all three cryptocurrency prices over time along with their trading volume. Data for all three is sourced from Coinbase.com and by request, we have shortened the time frame for a more recent picture.

We have also created an index in order to chart these together given their very different pricing history. Notice that Ether tops the chart – the price of an ether has changed the most out of all three cryptocurrencies.
….also from Jill:
The Four Totally Bad Bear Recoveries: Where Is Today’s Market?

Despite fears a Trade War would dull the Dollars appeal, the dollar Index jumped again this morning. espite consistent headlines declaring the US dollar will fall because of the US China trade war. As you can see from the chart below, while the US dollar did fall though long before trade war worries became persistant, versus a basket of currencies in fact it has moved up over 1 percent since the end of January. The USD/CAD currency is also covered below – R. Zurrer for Money Talks
Note: Double click all charts for larger images
In yesterday’s Forex Trading Alert at 9:31am, we took a closer look at the current situation in the USD Index:
From the short-term point of view, we see that the greenback came back above two important resistance lines – the previously-broken lower border of the black declining trend channel and the upper line of he blue declining wedge.
Yesterday, the index verified this breakout, which together with the buy signals generated by the indicators suggest further improvement.
How high could the U.S. dollar go in the coming day(s)?
In our opinion, the first upside target will be around 90.77, where the 38.2% (Ed Note: at 6:24am PST April 5th the US dollar is up +0.24 at 90.36) Fibonacci retracement and the March peak are. Additionally, in this area the size of the upward move will correspond to the height of the rising wedge (we marked it with the green ellipse), which increases the probability of the pro-bullish scenario in near future.
If this is the case and the index climbs to our first upside target, we’ll also see a realization of the bearish scenario in the case of EUR/USD as the exchange rate will test the March low and our downside target at 1.2173.
USD/CAD Rewards Bears
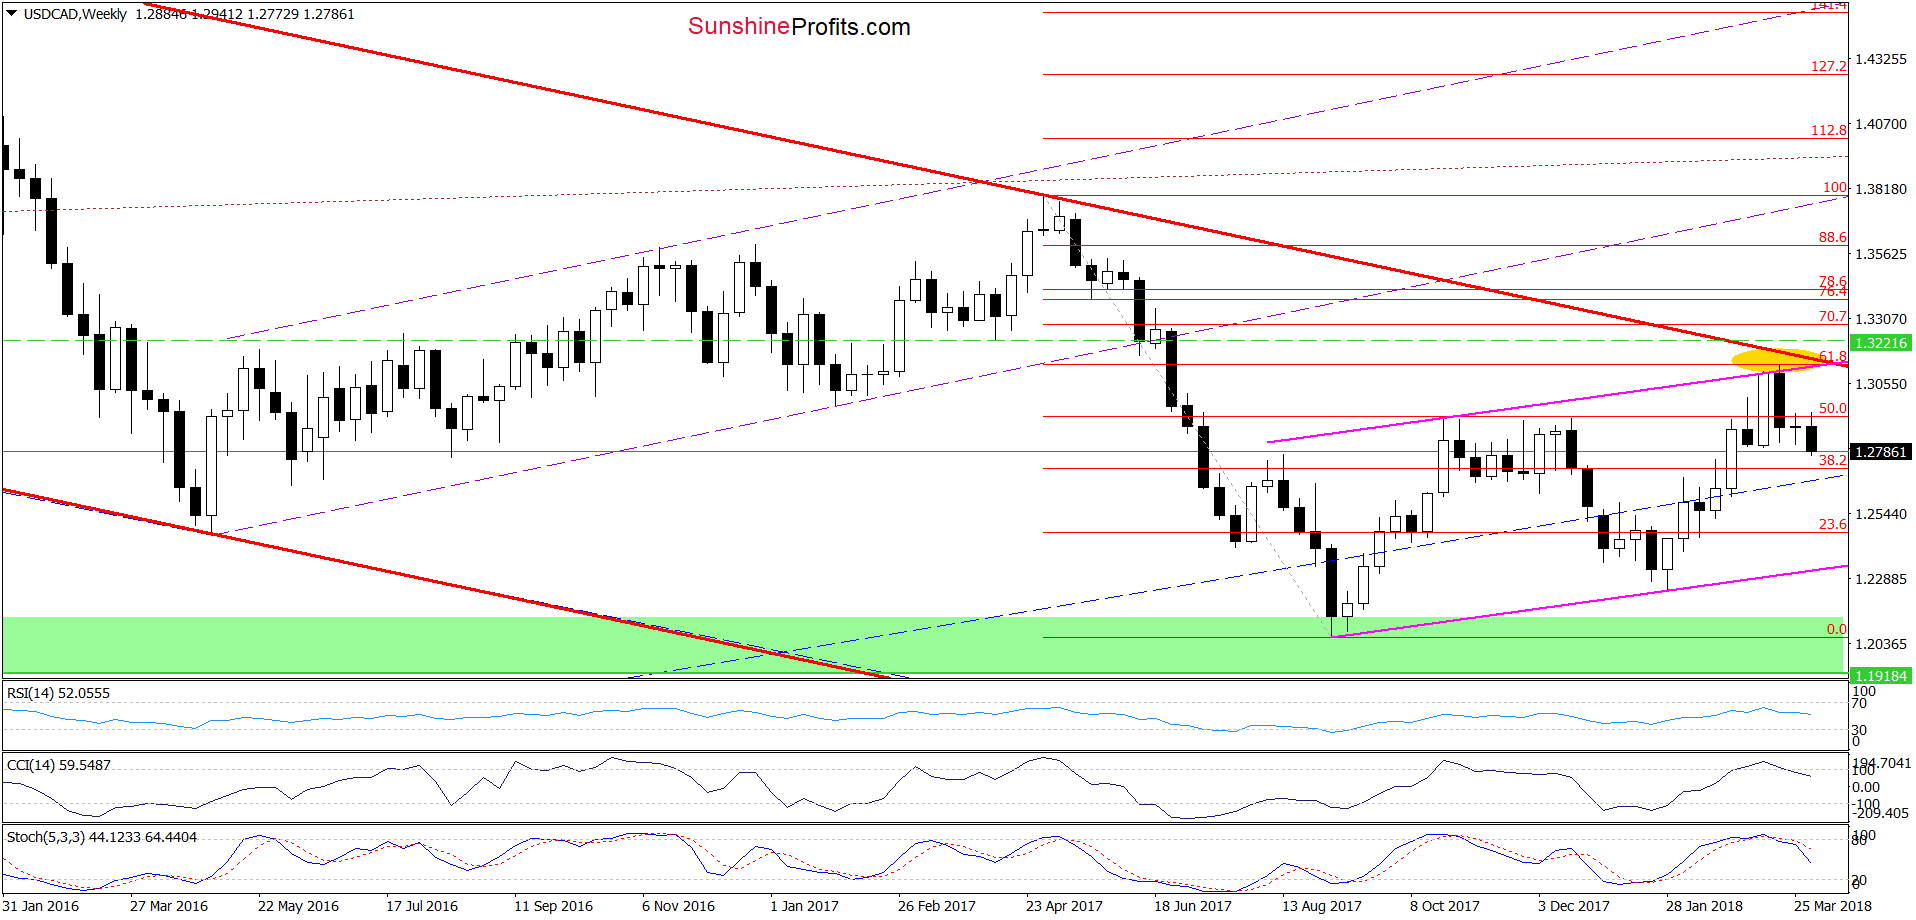
Looking at the medium-term chart, we see that although USD/CAD moved a bit higher earlier this week, currency bears took control quite quickly, which resulted in another move to the downside. Additionally, the sell signals generated by the weekly indicators remain in the cards, supporting currency bears and lower values of the exchange rate.
Are there any short-term factors that could thwart these plans?
Before we answer to this question, let’s recall the quote from our last commentary on this currency pair:
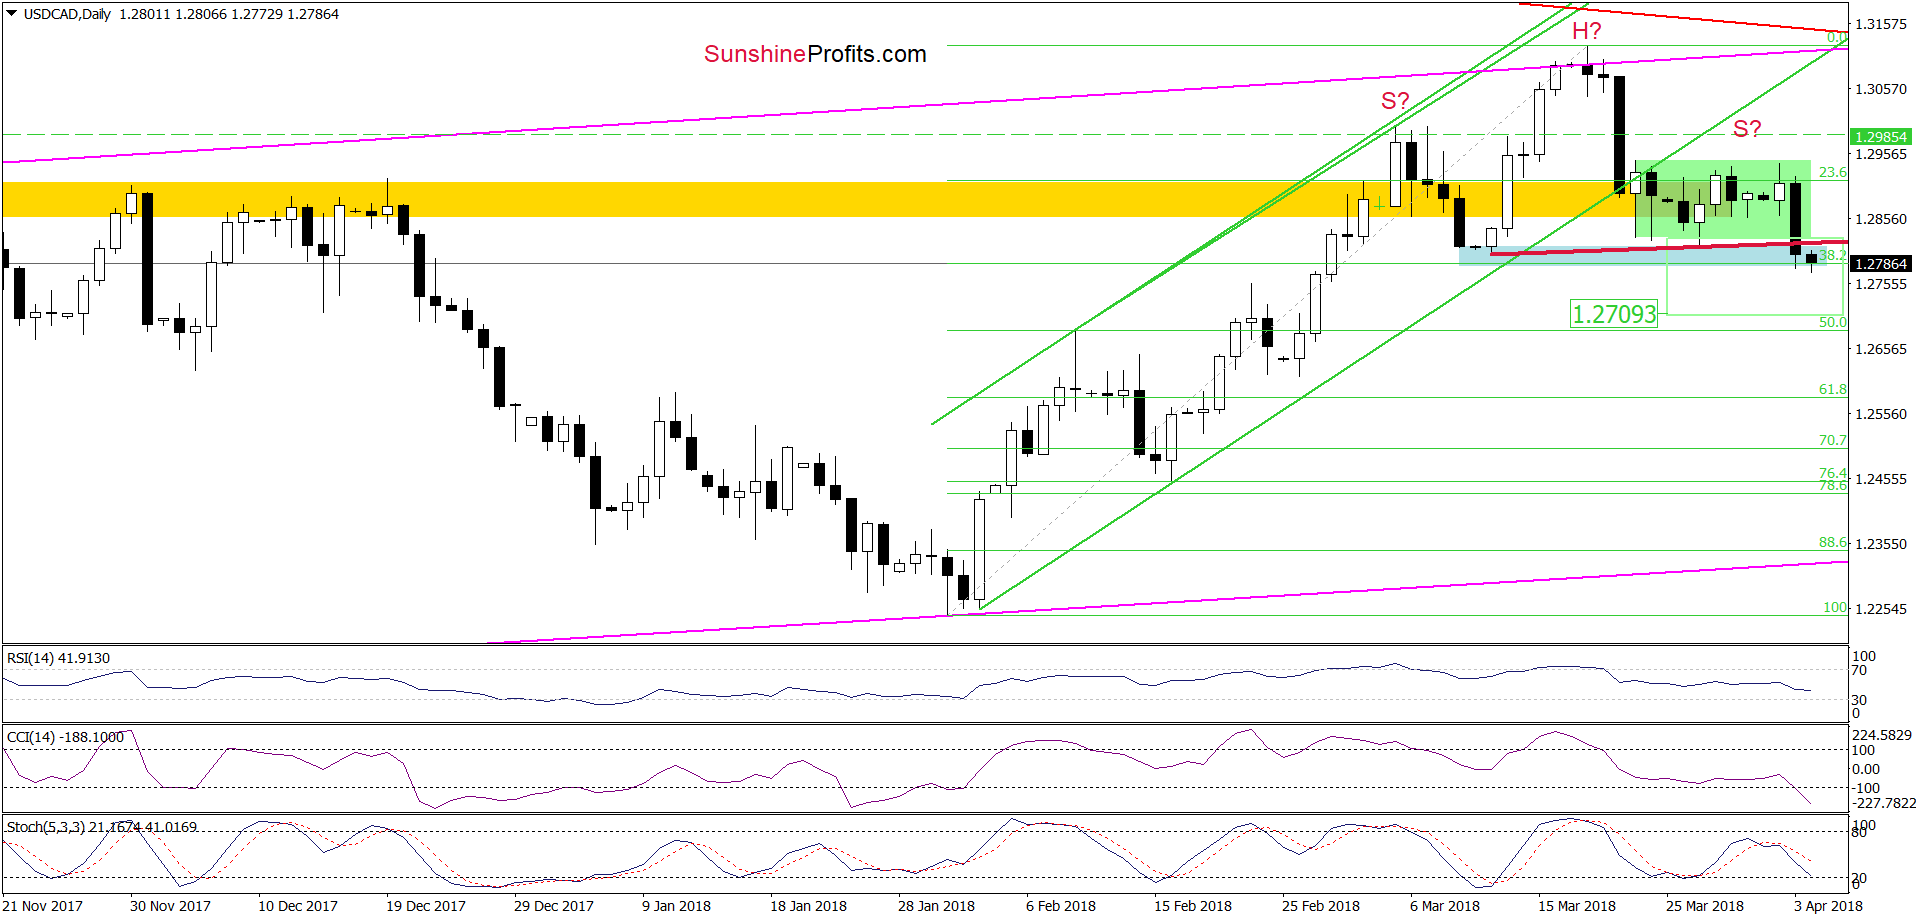
(…) although USD/CAD bounced off the blue support zone, the pair is still trading in the green consolidation around the yellow resistance zone and well below the previously-broken lower border of the green rising trend channel.
What does it mean for the exchange rate? In our opinion, as long as the pair remains under the upper border of the formation, another attempt to move lower is very likely.
If this is the case and USD/CAD extends losses from here, we’ll see (at least) a re-test of the blue support zone in the coming days, which will make our short positions even more profitable (as a reminder, we opened them on March 19, when USD/CAD was trading at around 1.3116).
As you see on the daily chart, the situation developed in tune with our assumptions and USD/CAD declined sharply after unsuccessful attempt to break above the upper border of the green consolidation. Thanks to yesterday’s downswing, the pair dropped under the lower line of this formation and reached our next downside target – the blue support zone and the 38.2% Fibonacci retracement.
Although this support area could trigger a rebound, the sell signals generated by the indicators remain in the cards, which together with yesterday’s breakdown suggest further deterioration and a drop to around 1.2709, where the size of the move will correspond to the height of the green consolidation.
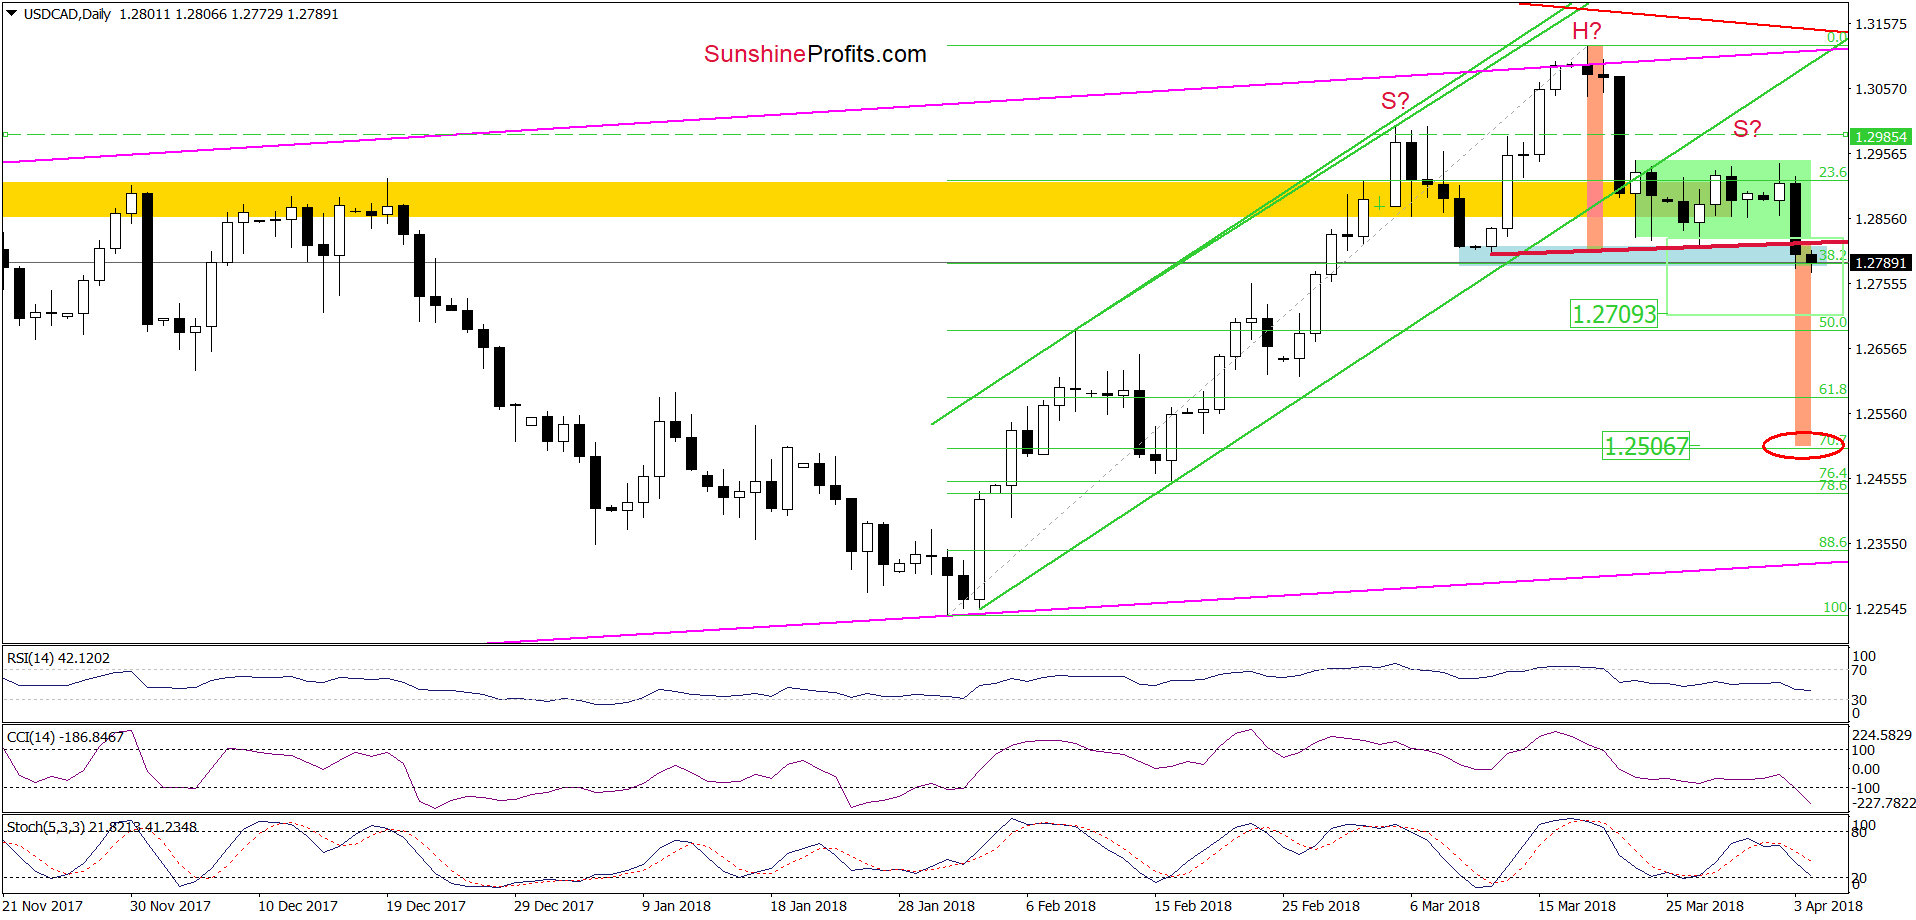
And speaking about the bearish potential… Looking at the daily chart, you probably already noticed a potential head and shoulders formation. You’re right, the right arm of the pattern doesn’t look perfectly like in technical analysis books, but yesterday’s downswing took the exchange rate under the neck line of the formation, increasing the probability of a bigger move to the downside. Nevertheless, in our opinion, such price action will be more likely and reliable if USD/CAD falls below the blue support zone. In this case, the likelihood of a decline under the above-mentioned downside target will increase significantly.
So, how low could the exchange rate go if the situation develops in line with the pro-bearish scenario?
In our opinion, the next downside target will be around 1. 2506, where the size of the downward move will correspond to the height of the head and shoulders formation. Nevertheless, before we see the pair at this level, currency bears will have to break under 50% and 61.8% Fibonacci retracements first. Therefore, we will continue to monitor the market and keep our subscribers informed should we see a confirmation/invalidation of the above.

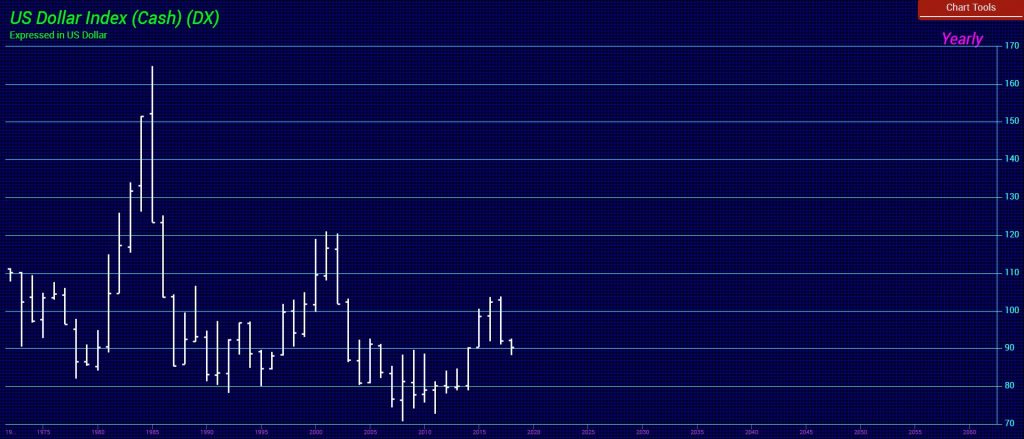
 Bloomberg has reported that dollar bulls are nearly extinct down to just 2.3 %. The majority, which is always wrong, are all focused on the nonsense of the budget and the current account deficits. The record high for the dollar was 1985 when even the British pound fell to $1.03. So the balance of payments went negative from 1980 to 1986 and the dollar rose. OMG!How was that possible? When you actually correlate the Balance of Payments with the dollar, something amazing emerged. The dollar rises with the balance of payments going negative. Gee whiz! That is against all perpetual bear’s reasoning.
Perhaps this magical logic is just sophistry because they use their theory and don’t bother to check if it holds up over the course of time. I have been warning countless times that the Balance of Payments is by no means simply TRADE. It includes all flows of capital outward. That includes interest. The biggest trade deficit of the USA is not with Europe, but China, who just so… Larger Chart
…happens to be the LARGEST investor in US government bonds. That means they collect the lion share of interest expenditures. The days of buying just pick umbrella for your cocktail are long gone.
The Balance of Payments bottomed in 2006 and began to rise from that 3rd quarter low. When did the dollar bottom? In 2008 as the Balance of Payments was improving. Strange! Guess that logic does not hold up.
Most people look at the Dollar Index for a guide as to being bullish or bearish. What they do not realize is how it is constructed is not really relevant. Currently, the index is calculated by taking the exchange rates of six major world currencies the Euro, Japanese yen, Canadian dollar, British pound, Swedish krona and Swiss franc. Then they apply a weight which is arbitrary. The Euro, for example, has a weight factor of 58%. The Japanese yen has a weight of about 14%. From a trade flow and capital flow perspective China is at the top of the list. The trade deficit with China (with includes interest expenditures that flow to China) stands at 123,676 billion compared to 343,078 billion for the entire European Union with Germany coming in at 49,363 billion. Japan now is still more in capital flows than Germany coming in at 67,117 billion. The weights that make up the Dollar Index are not truly reflected in either trade or capital flows. Furthermore, the index was created only in 1973. It shows the high in 1985 and the low in 2008, which really does reflect Europe rather than trade or even capital investment flows.
…..also from Martin after Thursdays Market drop: Market Talk- March 22, 2018

At one point the a Zimbabwe bank note was 100 Trillion Dollars. Jack Crooks has spyed another great currency collapse set to unfold. Fortunes will be made shorting the South African Rand. – Robert Zurrer for Money Talks
Quotable
“The malady of normative decay gnaws at order in the person and at order in the republic. Until we recognize the nature of this affliction, we must sink ever deeper into the disorder of the soul and the disorder of the state. A recovery of norms can be commenced only when we moderns come to understand in what manner we have fallen away from old truths.”
–Russell Kirk
Commentary & Analysis
Paradise in hell. Will the South African Rand morph into the Zimbabwe Dollar?

In case you didn’t notice (quite possible because it doesn’t fit the MSM narrative), the esteemed South African parliament, in their infinite wisdom, decided that yes, because the ANC has turned the country into a paradise in hell during its 24-year reign of corruption and incompetence, now is the time to blame white farmers (again) for the country’s problems by confiscating their land (without compensation) and doling it out to political cronies whose skin color most likely won’t be white and farming skills most likely won’t be near the expert category.
Here is the headline from the Daily Mail:
‘We are not calling for the slaughter of white people – at least for now’: South African parliament votes to SEIZE white-owned land as experts warn of violent repercussions
The New York Times, the paper whose slogan should be: All the news fit to spin, refers to this outrageous seizure as “land reform.” Finally, some “justice” say many inside the ANC, and out. So, I guess white South African farmers can feel good knowing it is just “land reform,” and the parliament didn’t vote for slaughter. Well they likely didn’t vote for slaughter because white South African farmers are already being slaughtered, tortured, and raped in impressive numbers. Where is their “justice.” Just asking?
I am looking forward to seeing how this works for South Africa; but I am not optimistic. After all, it seems as if its déjà vu all over again.
This brilliant racist idea of white farm confiscation worked so well for Zimbabwe, South Africa’s neighbor, the country went from a net exporter of its abundant food surpluses across Africa when whites ran the farms (very unfair indeed), into a complete basket-case. The country now cannot feed itself (thinking maybe it’s time for all those brilliant rock stars and actors to gen up a live aid concert so we can all weep and feel guilty about the problems in Zimbabwe—and of course send more money to be siphoned off into offshore bank accounts with nothing going to the people who really need it). Thanks again Robert Mugabe—another bright light African “leader.” Even the new President of Zimbabwe– Emmerson Mnangagwa; a man not exactly considered Mr. Sweetness and Light, admits maybe Mr. Mugabe went too far. You think!
That little rant of mine was supplied as background so I can ask this question:
No matter how far loony left, or racists you might be, at what point do you stop putting any investment capital into South Africa?
I don’t know the answer, as I am not sure why anyone would invest a penny their now. And I sure don’t understand why the South African Rand isn’t completely in the toilet already. But, given the latest outrage from the ruling ANC—darling party of the globalist left—it may not be long before investment starts drying up in a very big way; think of the humanitarian and social crisis in Cape Town, because of water supplies drying up, as a good analogy for the country going forward.
If you trade currencies, getting short the Rand could be the type of trade that makes a year—or more. Demand for the Rand will likely plummet as South Africa continues down the road to Zimbabwe, as the supply of the currency soars. Does anyone remember the Zimbabwe 100 Trillion dollar note? See below if you forgot just how bad it can get.

If Dandy Don Meredith were still with us, he’d likely be warming up his voice getting ready to sing his famous rendition: “Turn out the lights, the party is over!” Stay tuned.
Jack Crooks, President,
Black Swan Capital
772-349-6883/ Twitter: bswancap


