
Asset protection
Is this time different? I’ve often characterized our approach to the financial markets as a value-conscious, historically-informed, evidence-driven discipline. In recent years, we’ve often been asked whether the world has changed in a way that makes historical evidence an inadequate guide to investing.
Our own narrative in the half-cycle since 2009 certainly invites that question. While a good part of that was a self-inflicted outcome related to my fiduciary stress-testing inclinations in 2009, and we’ve adapted far more than is likely to be obvious until the present market cycle is complete (see Setting the Record Straight to understand those challenges and how we’ve addressed them), the broader question remains – do historical regularities no longer apply?
In Probably Approximately Correct, Leslie Valiant describes the conditions required by both living organisms and artificial intelligence “ecorithms” in order to learn and successfully use induction from observations drawn from the environment. In order to reliably learn from inference, two assumptions are required.
First, we can’t expect those lessons or generalizations to be useful in contexts that are fundamentally different from the environment that produced the observations used for learning. In other words, lessons learned in one world may be poor guides in a far different world. This, of course, has been the perennial argument of speculators during every bubble in history. But we should be careful about over-using that argument. The “invariance assumption” doesn’t require that the world cannot change – it only requires that there are some regularities that remain true. Second, some useful criterion or regularity must in fact be detectable. That is, there must be some “learnable regularity” that can actually be inferred from the evidence – a random world with no relationships between cause and effect is not an environment that will produce useful or predictive generalizations.
In some cases, those learnable regularities can be derived on the basis of clear theoretical relationships that describe how the world works with reasonable accuracy.
For example, every long-term security is fundamentally a claim on a very long-duration stream of cash flows that can be expected to be delivered into the hands of investors over time. For a given stream of expected cash flows and a given current price, we can quickly estimate the long-term rate of return that the security can be expected to achieve (assuming the cash flows are delivered as expected). Likewise, for a given stream of expected cash flows and a “required” long-term rate of return, we can calculate the current price that would be consistent with that long-term rate of return. The failure to understand the inverse relationship between current prices and future returns is why investors frequently argue that rich equity valuations are “justified” by low interest rates, without understanding that they are really saying that dismal future equity returns are perfectly acceptable.
We also observe the very regular tendency for profit margins to increase during economic expansions (presently corporate profits are close to 11% of GDP), and to contract during softer periods. Corporate profits as a share of GDP have always retreated to less than 5.5% in every economic cycle on record, even in recent decades. Since stocks are most reliably priced on the basis of long-term cash flows, and not simply Wall Street’s estimate of next year’s earnings, we find that valuation measures that are either relatively insensitive to profit margin swings, or that correct for their variation over the economic cycle, are much better correlated with actual subsequent market returns than measures such as price/forward operating earnings that don’t do so.
Our valuation concerns don’t rely on any requirement for earnings or profit margins to turn down in the near term. Valuation is a long-term proposition that links the price being paid today to a stream of cash flows that, for the S&P 500, have an effective duration of about 50 years. In evaluating whether “this time is different,” it should be understood that current valuations are “justified” only if 1) the wide historical cyclicality of profits over the economic cycle has been eliminated, 2) the average level of profit margins over the next five decadeswill be permanently elevated at nearly twice the historical norm, 3) the strong historical advantage of smoothed or margin-adjusted valuation measures over single-year price/earnings measures has vanished, and 4) zero interest rate policies will persist not just for 3 or 4 more years, but for decades while economic growth proceeds at historically normal rates nonetheless. Believe all of that if you wish. Without permanent changes in the way the world works, on valuation measures that are best correlated with actual subsequent market returns, stocks are wickedly overvalued here.
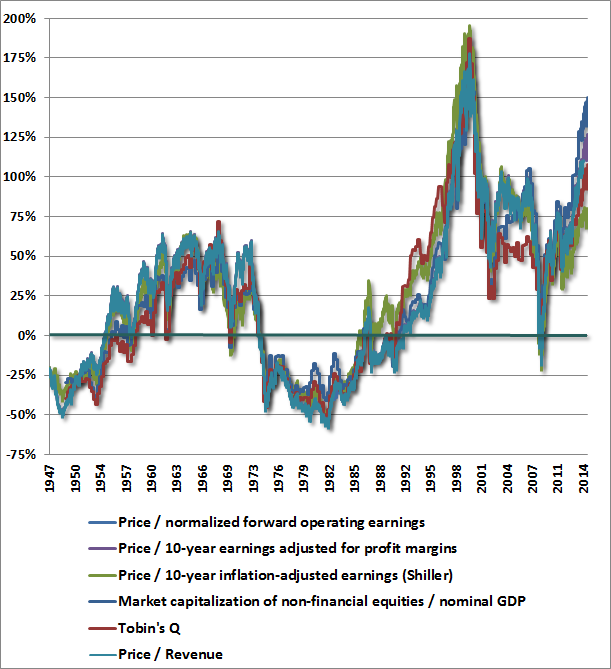
The charts below show several of the measures that have the strongest relationship (correlation near 90%) with actual subsequent 10-year S&P 500 total returns, reflecting data from the Federal Reserve, Standard & Poors, Robert Shiller, and valuation models that we have published over the years. The first chart shows these measures as the percentage deviation from their historical norms prior to the late-1990’s equity bubble. While it’s easy to lose sight of the extremity of the present situation, these measures are well over 100% above their respective norms, on average. On the most reliable measures, we estimate that S&P 500 valuations are now only about 15-20% short of the 2000 extreme, and are clearly above every other extreme in history including 1901, 1929, 1937, 1972, 1987, and 2007. Again, these measures are also better correlated with actual subsequent market returns than popular alternatives such as price/forward operating earnings and the Fed Model (which adjusts the S&P 500 forward operating earnings yield by the level of 10-year Treasury yields).
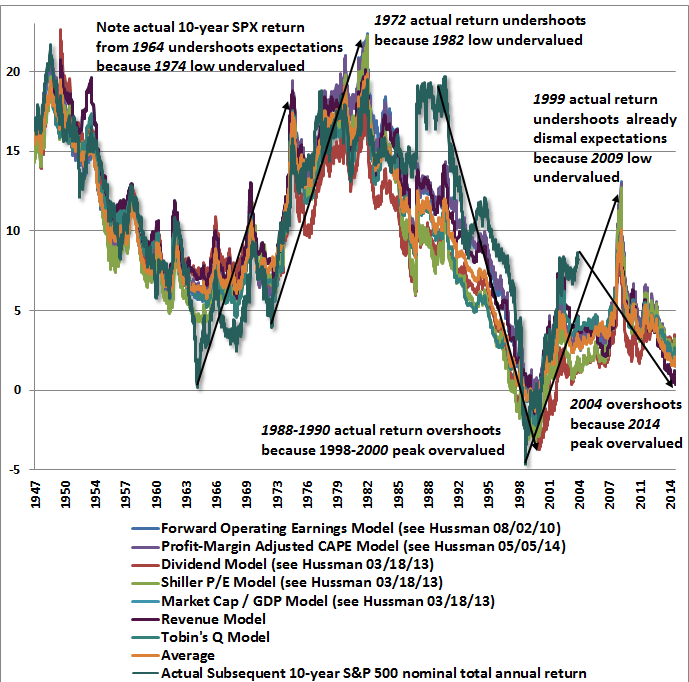
As of last week, based on a variety of methods, we estimate likely S&P 500 10-year nominal total returns averaging just 1.5% annually over the coming decade, with negative expected returns on every horizon shorter than about 8 years. The chart below shows the historical record of these estimates (in percent) versus actual subsequent 10-year S&P 500 total returns. What’s notable is not only the strong correlation between estimated returns and actual subsequent returns, but also that the errors are informative.
For example, notice that the actual 10-year S&P 500 total return in the decade following 1964 was significantly lower than one would have projected at the time. The reason is that the 1974 market plunge was so brutal, with the market losing half of its value, and bringing the new estimate of prospective returns to significantly above-average levels. Looking at this chart at the 1974 low, one might have been concerned that the methods were too optimistic since the prior 10-year return was so much worse than what one would have projected a decade earlier. Those concerns would have been unfounded, as the 1974 low represented one of the best secular buying opportunities in history, especially for the broad market.
Conversely, the actual 10-year S&P 500 total return in the decade following 1988-1990 was significantly higher than one would have projected at the time. The reason is that the 2000 market bubble was so extreme, bringing the new estimate of 10-year S&P 500 returns to negative levels. Looking at this chart at the 2000 peak, Wall Street would have undoubtedly argued that these measures of valuation had become unreliable or useless. That argument would have proved tragically wrong, as the S&P 500 promptly lost half of its value (three-quarters of its value for the Nasdaq), and posted negative total returns for well over a decade.
Given the full weight of the evidence, it should be clear that one can’t just say “well, look, the S&P 500 has done better than these models would have projected a decade ago,” and use that as a compelling argument that this time is different and historical regularities no longer hold. Quite the opposite – the overshoot in S&P 500 total returns since 2004 – relative to the prospective returns one would have estimated at the time – is highly informative that stocks are strenuously overvalued at present. That conclusion has strong statistical support. In fact, when we examine the historical evidence, we find that there’s a -68% correlation between the error in the projected return over the past decade and the actual subsequent total return of the S&P 500 in the following decade. That is, the more actual 10-year S&P 500 returns exceeded the return that was projected, the worse the S&P 500 generally did over the next10 years. Notably, the “Fed Model” has a correlation of less than 48% with actual subsequent 10-year returns. It’s sad when a valuation measure that is so popular is outperformed even by the errors of better measures.
Of course, there are also environments where either clear theoretical relationships don’t exist, or aren’t adequately recognized or understood, and people have to learn through a process of trial, error, and experience. That brings us to quantitative easing and zero-interest rate policy. Here, we have a mixture of clear relationships that aren’t adequately understood, as well as relationships that are largely psychological and can’t be derived mathematically.
On the subject of clear relationships, we know precisely how to quantify the impact that zero interest rate policy should have on valuations. Suppose, for example, that historically normal equity market valuations have generally been associated with Treasury bill yields averaging about 4%. Now suppose that Treasury bill yields are expected to be held at zero for the next 3-4 years. It follows (and this can be demonstrated with straightforward discounting arithmetic) that this expectation would “justify” stock valuations about 12-16% above their historical norms. That elevated valuation would adjust for the reduction in short-term interest rates by commensurately reducing the prospective future return on stocks by that same 4% increment for the next 3-4 years. The problem is that if this relationship isn’t recognized or understood, it becomes easy to casually argue “well, lower interest rates justify higher stock prices” without any concern that stocks are actually more than double reliable historical norms already.
Which leaves us with the effect of quantitative easing on the psychology of investors. It’s here where recent years have been particularly challenging for evidence-based, historically-informed analysis. Over the short run, market returns are driven by mindset, but ultimately, they are driven by valuation. As Benjamin Graham famously remarked, “in the short run, the market is a voting machine, but in the long run, it is a weighing machine.”
In the current cycle, central banks have stuffed the ballot box. That doesn’t make long-term prospects any better, but it has induced substantial yield-seeking speculation for several years running. In past market cycles across history, once the market established certain extreme conditions (which we’ve regularly described as “overvalued, overbought, and overbullish”), stocks typically retreated in relatively short order. In the half-cycle since 2009, that regularity appeared to largely vanish, and stocks have advanced even in the face of conditions that would normally have triggered a plunge. Again, this isn’t because higher valuations were justified by zero-interest rate policy, but rather because the policy has triggered persistent yield-seeking speculation despite valuations that offend empirically reasonable assumptions.
Fortunately, there’s a practical approach to adapt to situations when individuals behave in a way that ignores analytical relationships, and in situations where those relationships can’t be quantified directly. As Leslie Valiant correctly observes, for some classes of learning methods, “one can automatically translate a weak learning algorithm into a strong learning algorithm. The idea is to use the weak learning method several times to get a succession of hypotheses, each one refocused on the examples that the previous ones found difficult and misclassified.” In recent years, the difficult and misclassified conditions have primarily been those where overvalued, overbought, overbullish conditions were present, and yet the market was advancing in a way that was inconsistent with history. On that front, we’ve been faced with a good example of “this time” being “different.”
Notice that the strategy isn’t to abandon disciplined analysis or to discard every lesson of history. When one finds an aspect of the environment that legitimately appears “different,” the proper response is to embrace disciplined analysis even more strongly – focusing on misclassified instances and determining why they are misclassified. We know that the market often ignores monetary actions – the Fed was aggressively easing throughout the 2000-2002 and 2007-2009 plunges – so appeals to Fed easing aren’t enough. Since we’re analytically-driven investors and not data-miners, our efforts have been somewhat different than the “boosting” algorithm that Valiant describes, but the principle is much the same. In practice, we asked “historically, what has distinguished overvalued, overbought, overbullish conditions that were followed by air-pockets, free-falls, and crashes from similar conditions that had few negative consequences?” The answer? Generally speaking, the negative outcomes were coupled with either widening credit spreads or deteriorating market internals (what we’ve sometimes called “trend uniformity”). In the absence of such measures of increasing risk-aversion, those overextended syndromes have been much less hostile, on average. As it happens, implementing that “overlay” not only reduces the extent of misclassifications in the half-cycle since 2009, it also reduces misclassified defensiveness during other bubble periods such as the runup to the 2000 and 2007 market peaks.
What does all of this mean for the market at present? Since the initial “air-pocket” in stocks a few weeks ago, I’ve been careful to emphasize that I’ve had no opinion regarding near-term direction, and that we could observe either a corrective short-squeeze or a fresh market plunge. There was quite simply very little evidence that supported any directional view besides the expectation of continued volatility. Last week, however, the market re-established conditions extreme enough to place the present instance among what I’ve often called the “who’s who of awful times to invest.” Importantly, and in contrast to a few similarly extreme conditions we’ve seen in recent years, we presently observe both widening credit spreads and – at least for now – deteriorating internals and unfavorable trend uniformity on our measures of market action.
It’s certainly possible that credit spreads will narrow and market internals will improve. In that case, it won’t make the market any cheaper, but my impression is that it would mitigate the immediacy of our concerns. Longer-term, we would still anticipate dismal returns on a 7-10 year horizon, but an improvement in credit spreads and market internals would essentially be a signal that investors had shifted back to a more risk-seeking psychology at least for a bit.
In short, our views will shift as the evidence shifts, but here and now, the market has re-established overvalued, overbought, overbullish conditions that mirror some of the most precarious points in the historical record such as 1929, 1937, 1974, 1987, 2000 and 2007. That syndrome is now coupled with continued evidence of a subtle shift toward more risk-averse investor psychology, primarily reflected by internal dispersion and widening credit spreads. I’ve often emphasized that the worst market outcomes have historically been associated with compressed risk premiums coupled with a shift toward risk aversion among investors. In those environments, risk premiums typically don’t normalize gradually – they do so in abrupt spikes. We’ll continue to respond as the evidence changes, but under current conditions, we view the investment environment for stocks as being among a handful of the most hostile points in history.
The foregoing comments represent the general investment analysis and economic views of the Advisor, and are provided solely for the purpose of information, instruction and discourse. Please see periodic remarks on the Fund Notes and Commentary page for discussion relating specifically to the Hussman Funds and the investment positions of the Funds.
—
Prospectuses for the Hussman Strategic Growth Fund, the Hussman Strategic Total Return Fund, the Hussman Strategic International Fund, and the Hussman Strategic Dividend Value Fund, as well as Fund reports and other information, are available by clicking “The Funds” menu button from any page of this website.
Estimates of prospective return and risk for equities, bonds, and other financial markets are forward-looking statements based the analysis and reasonable beliefs of Hussman Strategic Advisors. They are not a guarantee of future performance, and are not indicative of the prospective returns of any of the Hussman Funds. Actual returns may differ substantially from the estimates provided. Estimates of prospective long-term returns for the S&P 500 reflect our standard valuation methodology, focusing on the relationship between current market prices and earnings, dividends and other fundamentals, adjusted for variability over the economic cycle (see for example Investment, Speculation, Valuation, and Tinker Bell, The Likely Range of Market Returns in the Coming Decade and Valuing the S&P 500 Using Forward Operating Earnings ).

Signs Of The Times
“Russia scrapped its second bond auction after the ruble’s retreat spurred bets that interest rates will increase.”
– Bloomberg, October 21.
“Russia’s international reserves shrunk for a ninth week, tumbling $7.9 billion in a little more than five months.”
– Bloomberg, October 23.
That week crude was trading at 84, nine weeks earlier it was trading at 98.
Recently it has been below 80.
“Russian tycoons seek to trim debt as [weakening] commodity demand hits values of holdings.”
– Bloomberg, October 28.
“Americans are less concerned than ever about another 1930-like Depression.”
– Rasmussen, October 23.
The numbers were that 27% thought it was “somewhat likely” and 62% polled “unlikely”. The report included that the poll was “more closely divided in 2009”.
And now for something completely honest – stupid but honest!
“Hillary: ‘Don’t Let Anybody Tell You That Businesses Create Jobs’ “
– Breitbart, October 24.
Perspective
While the stock market gets most of the attention during a boom, we all know it is not an isolated phenomenon. We have been talking about the connections to the credit markets, but the culmination of a bull market seems to be part of a universal euphoria.
On the stock side this showed up as a very low number of only 13.3% bears, the lowest since 1987. On the social side it shows up in this week’s Conference Board’s Consumer Confidence number. From 89.0 in September it soared to 94.5. This is not only a big jump, it is the highest reading since October 2007.
The low at its worst in 2009 was 39.8.
The University of Michigan’s Consumer Sentiment number for October rose from 84.6 to 86.4, which is the highest since July 2007.
The low in 2009 was around 56.
Perhaps there is a new economic law. Consumer confidence is inversely proportional to interest rates. Well, it must hold for central bankers as well.
Stock Markets
Some have attributed the stock market rebound to a bullish utterance by James Bullard, a normally “hawkish” Fed employee. As interpreted by the street, the Fed was getting concerned about the severity of the correction. At less than 10%, this was severe?
This is ironical as we have never been impressed by the school of research that imagines what the Fed would do given whatever the current circumstances are. The problem with this school is that every swing in the stock market, including every irresistible transition from boom to recession has to be rationalized in FedSpeak. In the 1970s the belief was that recessions were deliberately induced to bring the rate of CPI inflation down. Well, you had to be there.
Initial selling pressure set the low for the S&P on September 16th and our ChartWorks of the next day noted the excesses on the plunge in JNK had become acute.
This prompted the relief rally and the next Pivot noted that the volatility has changed from huge Daily swings to equivalently huge Weekly swings. We have been thinking that this “Weekly” swing is getting overdone.
This has shown up in last Friday’s Inverted Springboard readings in both JNK and the S&P. As noted in Monday’s “Volatility To Resolution” piece, the sharply overbought condition seems to be leading to the expected big test in November.
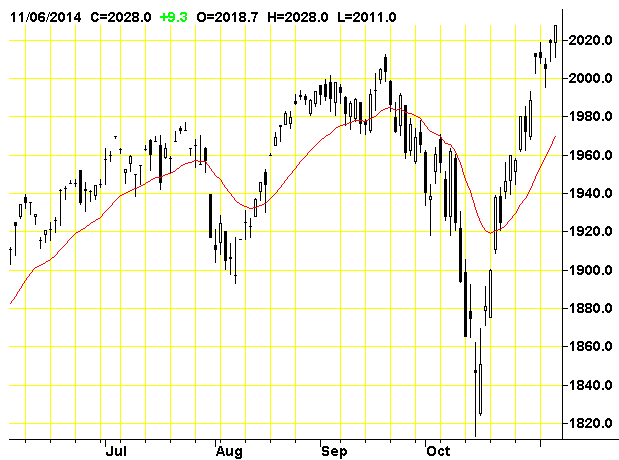
The most obvious S&P targets are the lows with the last hit. These are 1860 set on the October 16th close. On the extreme it could hit 1820, which was the intra-day low. Our theme since September has been the transition from Exuberance to Divergence to Volatility to Resolution. History has made it past the first three and is working on the Resolution to another outstanding financial mania.
On the way to the Resolution, the S&P seems to be within Ross’s “ABC” rally pattern.
Credit Markets
The Inverted Springboard signal on JNK was likely to have some effect this week. The index, without interest payments, set its rebound high at 40.56. This was at the 50-Day ma and the price has slipped to 40.30. This ma was also effective on the September rebound to 40.79.
The low close on the sharp setback in June 2013 was 38.72, which looks like a reasonable target for this hit. The low close on this decline was 39.22.
Whether this will be sufficient to correct the excesses of the biggest bond bubble in history remains to be seen. At any rate we have been out of the play since the big overbought in June.
Over in Europe the excesses have also been wondrous. Understandably, as central bankers, institutions and retail have all been speculating. The ECB, in so many words, has been “pounding the table” on bonds.
This drove the yield on Greek bonds down to 5.55% in June. This broke out at 6.69% in September and in a panic soared to 8.89% in the middle of the month. The retreat was to 7.34% on the 24th and it has increased to 8.18% today. Breaking above 8.89% would have serious implications.
In the middle of the month, Russian yields broke out at 9.90% and they reached 10.22% yesterday. The post-crisis low was 6.53% set in March 2013 and the crisis high was 12.90% set in February 2009. The chart follows.
The bond future can rally on the next decline in equities.
Commodities
Many commodities have rallied out of the oversold for the stock market.
Grains (GKX) have recovered well. The low was 290 and last week we noted that if the rise got through resistance at 310, the rally could run into the spring. That was accomplished on Friday and at 320, the index is comfortably above the 50-Day ma. In getting above 325, the move could make it to the 200-Day at 355. This seems to be the best chance for a rally since January.
On base metals (GYX) we have been looking for copper to lead us down to a tradable low in November. The low for the index was 340 on the low day for the S&P and metals rallied to 358 and stopped at the 50-Day ma.
The low needs to be tested and this could be accomplished on a seasonal low sometime within the next four weeks.
Crude oil has been likely to find a seasonal low in December, but the bounce with the stock market has taken it from 78.65 to 82.51 yesterday. The next low could set up a tradable rally.
Precious Metals
This week’s slump in the sector seems tied to the rebound in stocks and low-grade bonds.
Commodities rebounded as well giving our Gold/Commodities index a needed correction.
Otherwise, gold’s real price has been rising since June and we take this as the early stages of a cyclical bull market. This will eventually drive share prices up.
When will the latter start?
We had thought that the buying opportunity would be found towards the end of this month. Last week we still thought that the time had not arrived.
The HUI has extended its decline from 251 in June to 166 today. The cyclical high was 638 in 2011. It is worth mentioning that we use momentum on the silver/gold ratio to determine important tops. In 2011 the RSI soared to 92 when we noted that level had not registered since the magnificent blow-off in January 1980. We advised that speculation had reached a “dangerous” level.
The main force on the sector has been that it has been in a cyclical bear while the orthodox world has been in a cyclical bull.
This is in transition.
Another “Rotation” in most commodities seem possible and this would help precious metal stocks.
Iron Ore Prices
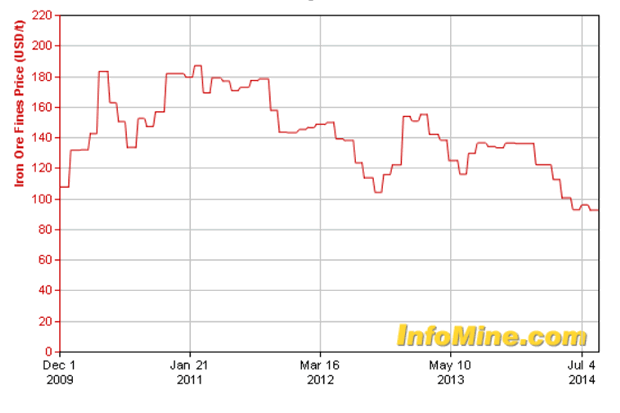
- The cyclical high was set in March 2011.
- This occurred with the cyclical peak in many commodities.
- Our proprietary model, the Momentum Peak Forecaster, gave a rare “Sell” that fateful April.
- The model does not provide “Buys” and it is uncertain when the general bear market will end.
Russia Ten-Year Note Yield

- Yields in Russia have been rising since the low of 6.50% in May 2013.
- Of interest is that it was a seasonal low with the rush of enthusiasm that can run into May-June.
- This was also the case with the decline from 9.52% to 8.38% in May of this year.
- This year’s breakout level was at 9.85% and that was accomplished on October 10th.
- This was a warning on most lower-grade bonds and the yield is now at 10.22%, which hasn’t been seen since 2009.
How Can Europe Service Its Debt Bubble?
Link to October 31st Bob Hoye interview on TalkDigitalNetwork.com: http://talkdigitalnetwork.com/2014/10/japan-injects-surprise-stimulus-to-world-markets

When the tech and real estate bubbles burst, many of my friends lost 40-50% of their retirement portfolios almost overnight. Is a similar downturn looming?
Take a look at the chart below showing the S&P’s performance since 2008.
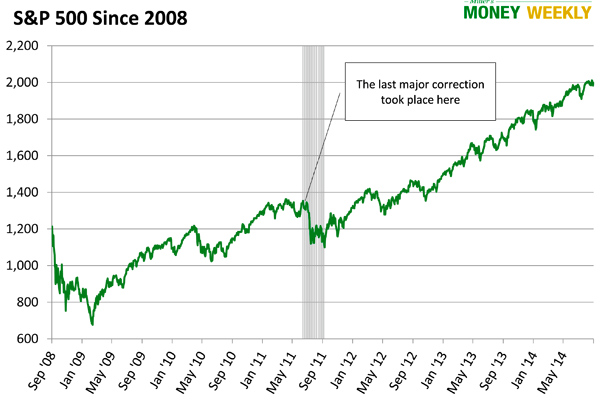
Caution is in order. We may see a major correction, a huge downturn, or this bubble could continue to grow for quite some time. I’ll leave the timing predictions to others. Still, investor euphoria worries me. Even those playing with retirement money often ignore warning signs, thinking the parabolic rise in stock prices is never going to end. However, this time is NOT different.
Look at the Nasdaq’s performance just before the tech bubble crash:
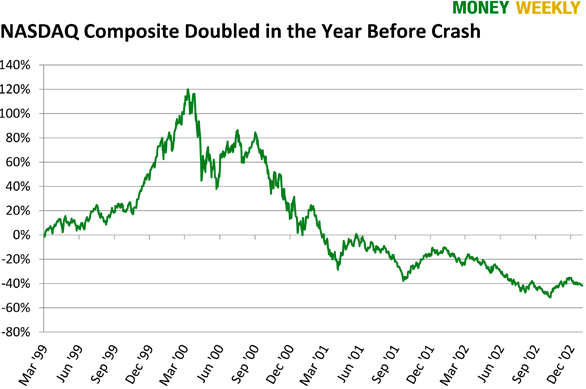
From March of 1999 to March of 2000, the Nasdaq doubled, and investors were euphoric. Are you feeling that euphoria today?
Don’t Let the Next Downturn Make You Poor
The goal for a retirement portfolio is to create enough of an income stream that you can maintain your current lifestyle over the long haul while the balance grows ahead of inflation. This portfolio should also include enough safety measures to keep you whole regardless of what the market does.
Sounds simple, but it can feel like walking and chewing gum—to the power of 10. Treasuries are supposedly safe… but from what? Sure, you won’t lose your principal, but they won’t protect you from inflation. Certain stocks are solid; after all, many companies survived the Great Depression… but will they keep paying dividends when you need them? Investing in a turbulent market is a gyroscopic balancing act with endless variables.
4 Lifejackets
While outlining the entire Miller’s Money safety system is beyond our scope here, there are four must-do safety measures anyone can easily implement.
#1—Set strict position limits. No single investment should make up more than 5% of your overall portfolio. That means rebalancing at least once a year. I have a friend who brags about how well his portfolio has been doing. Turns out, 80% of his holdings are in Apple. While Apple is a fine company and has done well, he should consider locking up most of his gain and focusing on capital preservation.
#2—Use trailing stop losses. We recommend setting trailing stop losses at 20% or less on all market investments. Stop losses can prevent catastrophic damage to your portfolio. As our portfolio grows, a trailing stop can help lock in a gain. While you may still face setbacks from time to time, a trailing stop limits them. You’ll live to fight another day.
I’ve spoken to some retirement investors who limit each holding to 4% of their portfolio and set 25% trailing stops. Whatever makes sense! Just limit the size of each position—and in doing so the potential for catastrophe.
#3—Diversification is the name of the game. This means internationalizing, too. Holding 5-6 mutual funds all in the United States or in US dollars just won’t cut it. You must diversify into non-correlated assets all over the world; so, should one segment or market tank, it won’t bring down a major portion of your portfolio.
You should also review the correlation of the asset you’re considering. What events in the market will cause the price to rise and fall? And pay particular attention to the near term. For example, until recently, utility stocks were considered the gold standard for retirees. Now there is so much capital in this sector, the stocks are correlating much closer to changes in interest rates.
Look for assets that are either uncorrelated to the market or those which may move in the opposite direction (the market goes down, this goes up, and vice versa).
Again, the game is: hold on to as much capital as possible and live to fight another day.
#4—Look for low duration on income investments. Bond sellers tout the safety of US government and investment-grade bonds. They are correct as far as default is concerned; however, a sudden rise in interest rates would mean a large loss for an investor holding these bonds who resells them in the aftermarket.
Retirement investors normally hold bonds for interest income, and they hold them until maturity. While some say bonds are still a good investment, most of these folks are traders. They buy high duration bonds (their market price moves significantly with changes in interest rates), betting on interest rates continuing to decline, and plan to sell for a profit down the road. We are not traders or market timers. Unless you are comfortable holding a bond until maturity, stay away from it.
When you invest money earmarked for retirement, using models that were in vogue as recently as 10 years ago will leave you vulnerable. Whether you’re considering bonds, utilities or any other investment vehicle, having the most up-to-date information is imperative. You can learn more about where bonds fit—or don’t fit—in your retirement plan by downloading our timely and free special report, Bond Basics, today. Access your complimentary copy here.
 It happens fast and it often comes without any warning to the general public. In 2008 they were able restore some confidence in the system through massive infusions of cash and a healthy dose of mainstream propaganda.
Back in 2008 we got a taste of what a massive economic and financial crash looks like. Millions of jobs were lost, tens of millions of people became dependent on government assistance, and trillions of dollars in wealth were wiped out almost overnight.
…..read more HERE

Still most read article. Huge volume – MT/Ed
Worldwide equity markets are a nuisance compared to worldwide debt markets. When you understand that derivatives (think leverage) all have interest rate components and have only seen falling yields the past thirty years. You better pay attention to the following chart. When this chart breaks the Fat Lady has sung and it is game over and I do mean over.

That is a six year topping pattern in the benchmark 10 year US Treasury Note. When that angled, complex pattern breaks down chaos will ensue globally. Examine what happened to the Yen when a similar pattern of HALF the duration broke down.
Harken back to 2008 when the real estate bubble popped. Everything tanked because real estate is illiquid and
everyone needed to raise capital and NO ONE could. Even the mighty GE had trouble rolling over debt. So ask yourself who is going to lend anyone money if rates start rising aggressively? Think about how much debt everyone is holding across the globe. Citizens, corporations, sovereign entities all have financing needs each and every day. Who will be the lender of last resort? Will everyone go to the FED and ask for a loan?
How many people managing money today have ever managed money in a runaway bond bear market? While the move in the late 1970’s was impressive the amount of leverage that existed in the financial system would not even register relative to today. That allowed Volcker to unleash his tightening madness.
How does gold factor into what we are about to see when that first chart breaks down? Again, in 2008 money rushed into the safe haven that is bonds. Now bonds become the source of panic? Where will money hide?
The supply and demand fundamentals for gold at this stage are already completely upside down relative to price. The price continues to follow the value of the yen relative to the dollar as we showed last year. And while some will have you believe that higher rates make gold even less attractive, they could not be more incorrect. When the bond bear comes gold will outperform and society as a whole is completely unprepared for the chaos that will unfold.


-
I know Mike is a very solid investor and respect his opinions very much. So if he says pay attention to this or that - I will.
~ Dale G.
-
I've started managing my own investments so view Michael's site as a one-stop shop from which to get information and perspectives.
~ Dave E.
-
Michael offers easy reading, honest, common sense information that anyone can use in a practical manner.
~ der_al.
-
A sane voice in a scrambled investment world.
~ Ed R.
Inside Edge Pro Contributors

Greg Weldon

Josef Schachter

Tyler Bollhorn

Ryan Irvine

Paul Beattie

Martin Straith

Patrick Ceresna

Mark Leibovit

James Thorne

Victor Adair