
Market Opinion
This extended sell off has everyone all worked up that this is the beginning of another market collapse.
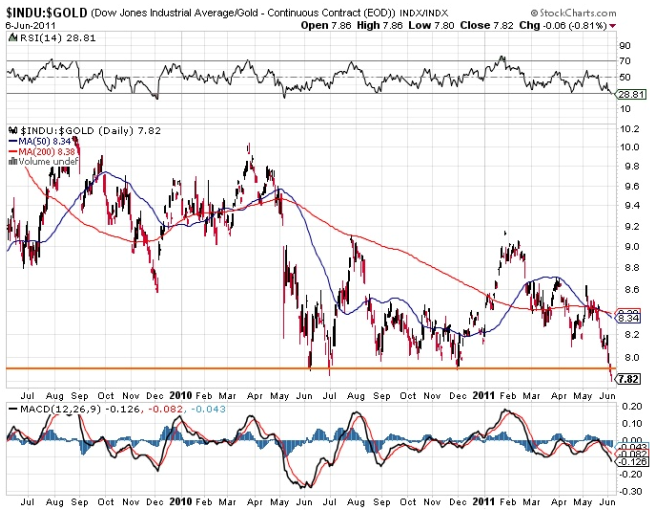
Collapsing stocks and strength in gold – translates into a falling Dow/Gold ratio.


Several observations can be made about the above charts:
1) From their late January low, both metals moved higher together more or less in synch.
2) Both gold and silver began their correction on the same day. In the initial drop, gold made its low on May 5th, but silver kept falling and made its initial low one day later on May 6th. It was a small bullish divergence because gold did not confirm the new low in silver, and both metals subsequently bounced higher.
3) The precious metals then re-tested their previous low. Silver fell to a new low in the setback on May 12th, but gold did not confirm. This was a second bullish divergence, and more meaningful than the first one a few days earlier for the simple reason that gold’s initial low price was still holding firm and had not been broken.
4) Then the precious metals again re-tested their lows a few days later. On May 17th gold broke below its May 12th low but not the low of May 5th, which has held throughout the correction. Silver broke below its May 6th low, but not the low reached on May 12th. It was the third bullish divergence, and this testing and re-testing of support in effect indicated that support at those price levels was solid. Both gold and silver again bounced higher, and their price rally continues as I write.
So gold and silver have formed what promise to be important bullish divergences signaling that the correction may have run its course. Here’s another way to look at what has happened. The selling in a precious metals correction can be compared to a prize-fighter at the end of a tiring bout. He is punched-out, and can hardly fight anymore. A divergence says the same thing. In effect, the downside momentum has ended because the sellers no longer have any ‘punch’ left.
There is one other item worth noting in the above charts, and it too is bullish. Look at the depth of the correction in silver compared to that of gold. Silver retraced more than half its gain from the January low, but gold hardly retraced any. What’s more, gold is now just a chip-shot away from making a new record high. This relative performance is itself an important bullish divergence.
So taking it all together, there are clear signals that the correction in the precious has ended. In other words, the low in gold and silver reached earlier this month marks the bottom of the correction. There may be more testing of support around $1500 and $35, which would not be unusual. There may even be more bullish divergences. But look favorably at the bullish divergences already formed because they in essence are saying that the correction may be ending, and more to the point, that the long-term bull market in the precious metals remains intact.
Lastly, the eagle-eyes among you may have noticed the bearish divergence on the above charts. Gold made a new high on Friday, April 29th, but silver did not confirm. A nasty correction began the following week.
In summary, spotting divergences is a worthwhile endeavor. Like everything else when it comes to markets, divergences are not foolproof. But they are a useful analytical technique that everyone can use to help keep their eye on price trends in a bull market.
….read the full report HERE
James Turk is founder and chairman of GoldMoney, which provides a convenient and economical way to buy and sell gold, silver and platinum online using digital gold currency for which he has four US patents.
The Recent Violent Market Moves
Going back some months ago we have a model we call the Momentum Peak Forecaster, and when it clicks in it means that speculation is going to surge and become absolutely irresistible. Now the signal was given at the end of December and typically, like for example in commodities in 1973 or in the big gold and silver market that peaked in January 1980, it really just goes straight up. When it gives the signal typically the play will blow out about three months later, or in this case around the end of March. Now we’ve seen the end of February the agricultural commodities stocks stopped going up and then later in March you saw the base metal prices stopped going up. Within our work we also expected that gold and silver would run further than the rest of the pack, and then separately on a seasonal basis we had crude oil, it would rally through April. Well that was the change. So here you a raging speculation, but we it reached measures. We do the silver gold ratio, and when you have a good bull market for these two markets silver will outperform gold, so the silver gold ratio was going up. We watched RSI momentum, and if it gets into the high 80s that’s dangerous territory. Well this got up to 92 which was in the neighborhood of where the speculation got in gold and silver in 1980.
So we had momentum, we had the timing within the window from which a violent reversal could follow and that was indeed our April 25th brief comment on gold and silver was that the reversal would be violent. Last Thursday’s pivotal events comment we sent out used the term violent, and then wham it came in violent.
There’s a bigger picture here than making just the call, it’s that the street was fully believing that the Federal Reserve and the Treasury operations in the states would depreciate the dollar forever, and you could get on board and you could ride commodities all the way up. But what happens is that the fed can’t control the speculation and any speculator [worth his salt] is going to be highly leveraged in this. Of course a futures contract is greatly leveraged. So when the play runs out of momentum and you get the first crack in the price, the speculators are forced to sell. On the way up everybody believes the fed can drive prices forever, then when the price drops the power shifts immediately to the margin clerks and they can outdo a fed or a central bank any time.
Current Dynamics
The silver community were all doing the supply demand analysis and you can go year after year and it’ll always show silver in short supply, like there’s greater demand than what’s coming. That’s a misleading game because in the credit cycle the gold silver ratio will ultimately perform like a credit spread. So this is where silver gave up 25% in four trading days and that’s horror show stuff. Then of course what you had was an artificially high price for crude oil. You had the seasonal rally and then you had an artificially high price because the terrorists were not taking shots at oil production or oil transportation and yet there was a big bid there on the fear that that might happen. It didn’t happen and silver and crude oil more or less reversed at the same time. What we want to look at is how severe this is beyond just the 25% drop in silver. How severe beyond the sell-off in crude, so horrendous it took three trading days to take away about three months of advance including dropping 9% in one day.
Again we’ve referred to our model the Momentum Peak Forecaster. When we had a big mania for commodities in 1973 you also at that time had trouble in the Middle East with the Yom Kippur war. The signal was given in November and the markets completed three months later. After that the National Bureau of Economic Research came along and said that the recession started in November of ’73 and that happened to be the month our Momentum Peak Forecaster gave its signal. Then we move ahead to the next big event which was the gold and silver speculation of 79/80, On that one our model gave the signal in November and the play blew out, and I always remember the date, January 21st of 1980. Later on the National Bureau of Economic Research, which is the semi official body that determines when recession starts and when they end, said that the recession started in January i.e. the month that this speculation completed. So here we are now. You had the signal of the Momentum Peak Forecaster given at the end of December, you had the play complete in March April, and now you’ve had the harsh hit to it. So we’re fairly confident that the recession will have been seen to have started in the month of May. It reminds me of the line “sell in May and go away” even though we didn’t get much into May.
Now, on crude oil that reminded me of the top of the bubble in crude oil in 2008 when it soared up to 147. That of course gave us all kinds of excessive signals on the way up. My colleague Ross Clark had a very good technical call on that one. The action in July of that year was that crude had a higher high than the month before, a lower low and then a close with a lower low. Here we are only a few trading days into the month of May and it’s already set the first part of an outside reversal to the down side. It’s had a higher high and a lower low and now we just have to be patient to the end of the month to see if it closes with a lower close. When we had the crude crash after that one from 147 it went all the way down to the 35 level. So yes, I think the speculative community has had severe damage.
The Bounce and Other Markets
The market’s are experiencing a bounce because it was a high velocity drop. I think that a lot of damage has been done. Also there’s other markets out there. For example the sovereign debt bonds, you had those out to new high yields some of them at 20%. Since the crash in March of ’09 you’ve had a fabulous rally, bull markets for corporate bond prices, they’ve been away up there. Nothing technically excessive over the last while, but back in ’07 what we were watching that was very good for us was those evil sub prime mortgage bonds. Well I’ve been watching those and they’ve had a good rally out of the disaster in ’09. Then in February a couple of the issues we were watching did a spike up in price and came down. One has broken down completely which says that that fun in the sub prime market is over and there’s going to be problems.
Also you had a very good rally in the municipal bonds out of a horrendous disaster and it’s now up to a technical top and could roll over in the next little while. So the damage, or let’s say the future troubles may not just be in what follows an excessive bubble in commodity prices. You have other markets out there. The corporate market is now vulnerable, and the sub prime market is telling us as it did in ’07 that there could be problems in credit markets. So it’s best to be wary in all departments.
Interest and Mortgage Rates
The debt has to be serviced and the US is a terrific example now whereby government employees, municipal employees have unions and they are they are taking above market returns for their wages. Also for their pension benefits and they won’t back off. I figure we’re just in the next recession already so you’re going to have tax revenues flowing down while you have horrendous demands by the Government unions. I think the only way out is that these many cities have to go broke in order to get the pensions and the power of the union’s diminished. I think that’s probable so you don’t want to be in those bonds. Then on the corporate bond side, for ages, for most of financial history rising prices are associated with good times, and falling prices with hard times. Indeed it shows up in, for example, S&P earnings. They go up and down with commodity prices. The way it works is that when commodity prices are going up it reflects a good pricing power by businesses and then when they go down that shows the pricing power is not so good. Their margins begin to get tight, their earnings diminish, and when earnings go down they have difficulty servicing debt.
Then of course you always got the rating agencies out there looking and watching for credit changes. When you’re in a condition where companies are unable to service debt they get the down grade and the price of their bonds go down. So it’s not a pretty picture. It’s highly probable that another business cycle recession is will be the dominant feature for the next year or so.
The Treasury bill rate I don’t see it going up too much. We were on a very good long government bond rally with US Treasuries then they got super bearish a couple of months ago on the credit down rating. Bill Gross at Pimco said that he was actually short US Treasuries at the 118 level and now they are up to 124. All of these instruments have to be traded but then what do you do for the quiet investor? Well this government rally is on and it could go for a while yes, but one would be a little careful in here and you’re going to get the safest return out of the three to four year maturity. If you’re in too short an instrument every roll over you’re going to get next to nothing. If you’re out at the long end and the bond market decides to take a price drop you get hit that way. In stormy times we kind of like to be in the three to four year maturity and just on what we call the cusp of the curve there. As for mortgages I guess lock in short rates, because mortgages will eventually be a problem in a market where credit worthiness is disappearing quickly.
The Canadian dollar
From the point of a trader it went up with commodities and it was particularly tied to crude oil and now it’s heading down. We think we’re in a cyclical decline in all commodity prices, so I think the Canadian is going to go down. But if this new Canadian government is wise, and I don’t think they can move quickly on it, it would be best all round to keep the Canadian dollar at par with the US, it takes a whole lot of friction and hedging out of the game. I think the Canadian dollar will drift down and one obvious target is Par.
Risk and Junior Gold Exploration Stocks
Bob Hoye: Yes. Another one way you can look at this, for example, I think we are in a long bull market for junior gold exploration stocks, it’s just the way it works after a great bubble. But a number of the ones I was in just got up in price, I mean a great zoom and as a trader you just can’t help but trade. So you got the end of the month and you’ve got a large amount of cash in my account. So you’ve got a cushion so that if there are some stocks that are not yet moved yet you can acquire those, or you can reenter the ones you bought previously at lower prices. The way Ross and I work is that we have some targets for the decline in gold, for the decline in silver and crude oil. When those targest approach then we’ll have opportunity and buying levels for individual gold and silver stocks. You end up being methodical and it’s a nice thing, it’s a nice place to be so.
Bob Hoye of Institutional Advisors
With a degree in geophysics and a number of fascinating summers in mining exploration, one winter in “the bush” quickly led Bob into the financial markets. This included experience on the trading desk and in the research department of a large investment dealer, which led to institutional stock and bond sales.
Bob’s review of financial history provided the forecasting models designed to anticipate significant trend reversals in the sometimes alarming volatility typical of the transition from rampant speculation in tangible assets to fabulous speculation in financial assets.
In anticipation of the latter opportunity, a monthly publication for financial institutions was started in January 1982.
This competently covered the stock market, the yield curve, credit spreads as well as metal and energy prices.
In 1998 the Institutional Advisors website was started as a forum for unique and reliable financial research.
Bob, as chief financial strategist, writes the weekly overview – PIVOTAL EVENTS. Contact Bob.
May 5, 2011 at 11:33 AM EST – Gold $1,481 Silver $35.75.
After literally getting out within minutes of the top in silver and gold and then watching a decline I anticipated could take weeks or months happen in a matter of days, I believe it’s time to go back in and buy back those positions.
I may be 10% too early but we have plenty of room given what we sidestepped.
So I’m now back in fully in gold and silver
I will do an update on Grandich Clients by Monday’s opening. In the meantime, I’m putting a very significant amount of cash back into the junior and mining sector. I purchased 200k shares of ADV yesterday and today, have bids in for FCO, MIN, SQI and NDM and am looking at many others. Not a time to chase but to start picking spots.
It’s fast moving and I’m trying my best to keep you fully informed of my thoughts… I even gave up a round of golf this afternoon! – Peter Grandich Grandich.com
-
I know Mike is a very solid investor and respect his opinions very much. So if he says pay attention to this or that - I will.
~ Dale G.
-
I've started managing my own investments so view Michael's site as a one-stop shop from which to get information and perspectives.
~ Dave E.
-
Michael offers easy reading, honest, common sense information that anyone can use in a practical manner.
~ der_al.
-
A sane voice in a scrambled investment world.
~ Ed R.
Inside Edge Pro Contributors

Greg Weldon

Josef Schachter

Tyler Bollhorn

Ryan Irvine

Paul Beattie

Martin Straith

Patrick Ceresna

Mark Leibovit

James Thorne

Victor Adair