
Market Opinion
The action of the past two trading days in gold and silver has investors questioning not only the short term outlook, but the validity of the decade long bull market’s ability to continue on the upside. Our technical analysis has centered on the intermediate moves. This break is not out of line with those seen in previous bull markets.
The news of the Swiss government’s intervention in the currency market is far bigger than most can even imagine. The author of this article copped on to that. The currency war has officially begun. A key benefactor should be gold. – Peter Grandich
Switzerland move threatens currency war
Switzerland is moving aggressively to weaken its franc and protect exports from watches to chocolates, sparking fears of an escalating currency war that would ripple through markets and other economies.
For months, the Swiss National Bank tried to rein in its surging currency by lowering interest rates and injecting francs into the market, but that did little to dissuade investors who viewed the franc as one of the few safe places to keep their money in a world of economic turmoil.
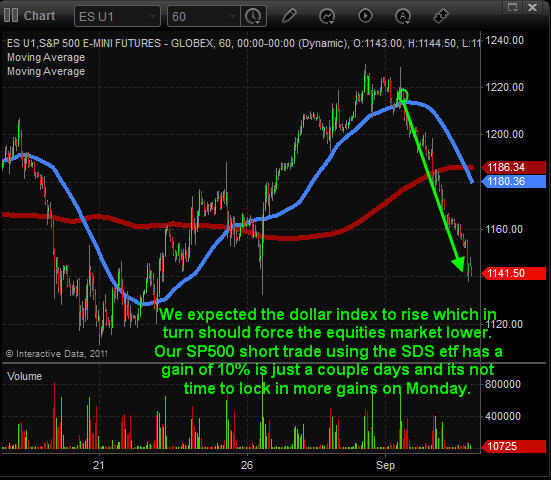
I’m not really sure how many people watch the futures market but I do know the majority of people do not. There was a Black Monday the Public Doesn’t Know About yet. So Tuesday morning there will be a lot of people in a panic when they see stocks gap down sharply.
Ross Clark of Chartworks began his career in 1974 at the heart of the bear markets for the equities, a point in which technical analysis was in its infancy. Ross looks for signals that occur within a trend or a consolidation that are similar to ones that have occurred in the past. Money Talks interviewer Michael Levy has been following the gold markets since 1968 and thinks Clark’s calls on the gold market have been “phenomenal, and his work which facilitated those calls has been nothing short of spot on.”
A summary of Ross’s latest comments from his 12 pages of charts and analysis below:
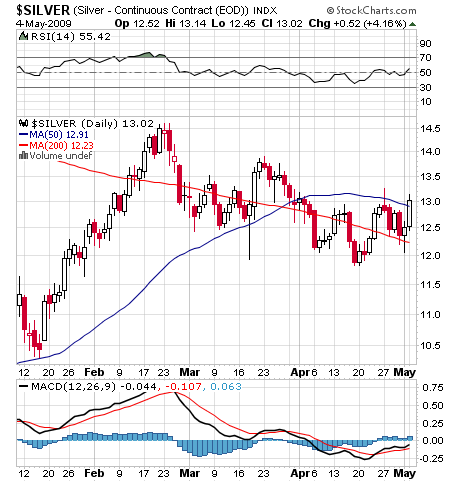
- The rebound rally in silver following the high Silver/Gold ratio in April called for a rebound and ‘false breakout’ in the 15 to 18 week window. Once in place the high was to occur within one to three trading days. The ‘breakout’ occurred on Friday, August 21st and within 1 ½ days of the reversal. Look for a 62% retracement to $37.60.
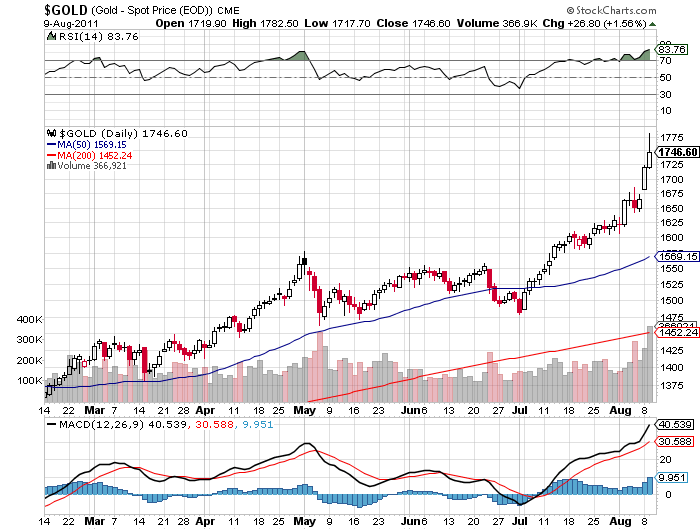
- Summer rallies in gold that start early and make new highs for the year in July top out in 32 to 34 trading days (Now six times in forty years). This year took 35 days.
- Tops generally occur within three weeks of a weekly Upside Exhaustion alert. This one took 2 ½ weeks and was coupled with a daily reading in GLD on August 22nd.
- The correlation with the TBonds of 1998 (and the PEI cycle) called for a high around August 17th. Occurred within three trading days of the optimum date.
- Even in the most bullish market (1976 to 1980) gold paused at the upper resistance line in July 1979 using a semilog chart. This week reached the upper resistance line at $1900.
- Seasonal patterns have shifted this year with a high due now. A six week consolidation/correction is likely.
- The Gold/Oil ratio is at the top of a forty year channel, implying profitability for mining stocks, however the stocks could easily correct by 20% before the next advance get under way.
- The XAU/Gold ratio is bottoming and suggests that the next phase of the bull market in gold will see an improving participation by the mining stocks.
- The Dow/Gold ratio continues in the theme of a secular bear for equities and a bull market for gold.
View Ross Clark’s 12 pages of charts and various technical studies HERE
08/23/2011 – Today’s bearish outside reversal in gold and silver in the appropriate time window for a top sets the stage for a decline into September. Initial breaks from tops typically take six to nine trading days. Silver should retrace a Fibonacci 61.8% or more of the advance from June; targeting $37.60. Gold should straddle the 50 day moving average ($1670) within two weeks – Ross Clark via Institutional Advisors,
…to view larger charts go HERE
…to view larger charts go HERE
-
I know Mike is a very solid investor and respect his opinions very much. So if he says pay attention to this or that - I will.
~ Dale G.
-
I've started managing my own investments so view Michael's site as a one-stop shop from which to get information and perspectives.
~ Dave E.
-
Michael offers easy reading, honest, common sense information that anyone can use in a practical manner.
~ der_al.
-
A sane voice in a scrambled investment world.
~ Ed R.
Inside Edge Pro Contributors

Greg Weldon

Josef Schachter

Tyler Bollhorn

Ryan Irvine

Paul Beattie

Martin Straith

Patrick Ceresna

Mark Leibovit

James Thorne

Victor Adair