
Market Opinion
10/30/09 Gualfin, Argentina – Regular readers of this space will recognize this as the third in a series. Irregular readers will not recognize it at all. They will look at us as though we had come from Mars. Earthlings are all convinced that a financial crisis of cosmic proportions befell the planet last fall. Had the authorities failed to act with determination and speed, it would have been the end of the world. In the popular mind the politicians have saved capitalism from its own excesses.
Our views are different, but not extra-terrestrial. Once upon a time, not so long ago, they were even respectable. The gist of our message two weeks ago was that debt is dangerous. It feels good at first. But give a society too much debt – either in its private sector or the public sphere – and someone’s going to get killed. That’s why the present situation is such a delight to serious economists; it offers more data points. We get to see how much straw the feds can add before the poor camel’s back breaks.
What’s the best way to get through a debt crisis?
……read more HERE.
For some perspective on the current stock market rally and how it compares the 1929-1932 bear market (which also included bank failures, bankruptcies, severe stock market declines, etc.), today’s chart illustrates the duration (calendar days) and magnitude (percent gain) of all significant Dow rallies that occurred during the 1929-1932 bear market (solid blue dots). For example, the bear market rally that began in November 1929 lasted 155 calendar days and resulted in a gain of 48%. As today’s chart illustrates, the duration and magnitude of the current Dow rally (hollow blue dot labeled you are here) is greater than any that occurred during the 1929-1932 bear market. Chart courtesy of ChartoftheDay.com signup Free
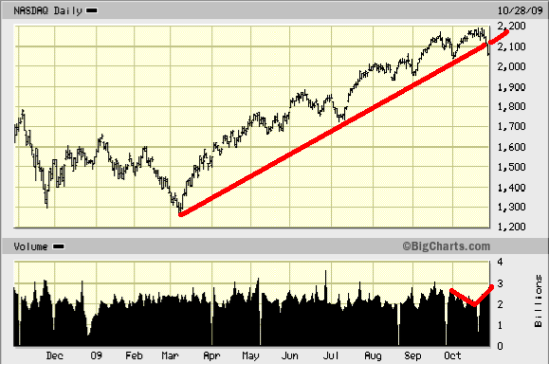
“Even the most adamantly bullish amongst us has to admit that the NASDAQ’s performance over the past several days has been anything other than bullish and that the trend line drawn here has clearly been broken… clearly!”
“At the moment, we fear that we are only now seeing the beginning of this selling; that the public has only just gotten long after remaining out; and that they’ll not begin liquidating until prices are lower and their hopes have been dashed yet again.”
Finally, we wish to keep things as simple as possible, for all too often complexity breeds confusion. The advance here in the US has been led by what we’ve referred to as “The Generals:” Apple and Goldman Sachs.


They were, and they are, the very best of breed, and their leadership rallied the lesser troops around them to move higher; to charge high; to rise to greater heights in the bull run from the March lows. But yesterday, the Generals were, if not killed, seriously wounded. GS left an “island reversal” to the downside two weeks ago, and yesterday, the uptrend line that defined the bull run was unequivocally broken. One General dead.
This brief comment from the Legendary Trader Dennis Gartman. For subscription information for the 5 page plus Daily Gartman Letter L.C. contact – Tel: 757 238 9346 Fax: 757 238 9546 or E-mail:dennis@thegartmanletter.com HERE to subscribe at his website.
Mr. Gartman has been in the markets since August of 1974, upon finishing his graduate work from the North Carolina State University. He was an economist for Cotton, Inc. in the early 1970’s analyzing cotton supply/demand in the US textile industry. From there he went to NCNB in Charlotte, N. Carolina where he traded foreign exchange and money market instruments. In 1977, Mr. Gartman became the Chief Financial Futures Analyst for A.G. Becker & Company in Chicago, Illinois. Mr. Gartman was an independent member of the Chicago Board of Trade until 1985, trading in treasury bond, treasury note and GNMA futures contracts. In 1985, Mr. Gartman moved to Virginia to run the futures brokerage operation for the Virginia National Bank, and in 1987 Mr. Gartman began producing The Gartman Letter on a full time basis and continues to do so to this day.
Mr. Gartman has lectured on capital market creation to central banks and finance ministries around the world, and has taught classes for the Federal Reserve Bank’s School for Bank Examiners on derivatives since the early 1990’s. Mr. Gartman makes speeches on global economic and political concerns around the world.
Marc Faber the Swiss fund manager and Gloom Boom & Doom editor said the US dollar will become worthless when people eventually realise the fiscal situation in the US is a “disaster”.
Speaking today in an interview on Bloomberg TV, Faber said: “It will go to a value of zero eventually, but not right now”.
“I think it will take about 10 years until people realise that the fiscal situation of the US is a complete disaster,” Faber added.
The famed investor reiterated his long-held views that the Federal Reserve’s expansionist monetary policies are the causes of the financial crisis by creating a large amount of leverage in the system and creating a credit-addicted economy.
….read more HERE.
Gold bullion entered into a period of seasonal strength in the second week in July. Gains since then have been significant thanks mainly to weakness in the U.S. Dollar. Where does gold bullion go from here? Chart above Via The Chart Store
Seasonal Influences
According to Thackray’s 2010 Investor’s Guide, gold bullion has a period of seasonal strength from July 12th to October 9th. The trade has been profitable in seven of the past 10 periods for an average gain per period of 4.8%. This year, short term momentum indicators recorded a buy signal on July 10th at $907.30 U.S. per ounce. Short term momentum indicators remained positive beyond October 9th, the average optimal exit date. Profit taking for the current period of seasonal strength is pending. Likely timing of a technical sell signal is this week. Gold also has a second period of seasonal strength from the end of November to the beginning of February.
Technical Influences
The breakout by gold above its all time high at $1,033.90 per ounce at the beginning of October implies a significantly higher technical target. Gold completed a two year reversal pattern with an intermediate term technical target of $1,300. However, its $80 per ounce gain since the beginning of October has been excessive and a period of consolidation is likely. Short term momentum indicators (Moving Average Convergence Divergence, Relative Strength Index and Stochastics) are overbought. The end of the current seasonal trade will occur when short term momentum indicators roll over and record sell signals. Intermediate downside risk is to $941 U.S. per ounce, its 200 day moving average.
Fundamental influences
Most of the strength in gold bullion is due to weakness in the U.S. Dollar. The U.S. Dollar fell to a 13 month low last week and has yet to show technical signs of bottoming. International investors and central banks continue to diversify their holdings out of U.S. Dollars. The annual $1.4 trillion U.S. government deficit announced last week encouraged international investors to accelerate their efforts to diversify. On the charts, the U.S. Dollar currently is deeply oversold and due for a short term recovery. However, fundamental reasons for the weak U.S. Dollar have not been resolved. Government spending continues to accelerate and deficits continue to grow. A brief recovery in the U.S. Dollar and subsequent weakness in gold will be followed to a reversion to current trends.
Gold faces a barrier to significant short term gains. The International Monetary Fund (IMF) plans to sell 403 tonnes of gold into the market in an orderly manner in unison with sales by European central banks. However, the IMF is willing to negotiate sale of part or all of the gold to one or more major buyers. Negotiations with the Chinese government to purchase at least part of the block are rumored. The IMF has an incentive to liquidate at least part of the block before the end of this year in order to support emerging nations that have suffered unduly from the world financial crisis. A deal to distribute proceeds of the sale could become part of an international agreement on climate change scheduled for negotiation in mid December in Copenhagen. Completion of an agreement to sell the block is the likely trigger for the next major upside move in the price of gold.
What to do
Investors holding gold bullion are in an enviable position. Should they take profits during the current period of seasonal strength that started in July or should they wait until the end of the next period of seasonal strength from the end of November to the beginning of February? Holding between now and the end of November implies downside risk of approximately 10%. On the other hand, holding until next February offers intriguing upside potential. Investors will make the decision this week based on their personal investment circumstances and ability to take risk.
Don Vialoux has 37 years of experience in the Investment Industry. He is a past president of the Canadian Society of Technical Analysts (www.csta.org) and a former technical analyst at RBC Investments. Don earned his Chartered Market Technician (CMT) designation from the Market Technician Association in 1995. His CMT paper entitled “Seasonality in Canadian Equity Markets” was published in the Spring-Summer 1996 edition of the MTA Journal. Don also has extensive experience with Exchange Traded Funds (also know as Index Participation Units) as well as conservative option strategies. In 1990 he wrote a report that was released in the International Federation of Technical Analyst Journal entitled “Profiting from a Combination of Technical and Fundamental Analysis”. The report introduced ” The Eight Phases of the Stock Market Cycle”, an investment concept that continues to identify profitable entry and exit points for North American equity markets. He is currently a member of the Toronto Society of Fundamental Analyst’s Derivatives Committee. Now he is the author of a daily letter on equity markets available free on the internet. The reports can be accessed daily right here at www.dvtechtalk.com.
Disclosure: Mr. Vialoux does not own securities mentioned in this report.
Disclaimer: Comments and opinions offered in this report at www.timingthemarket.ca are for information only. They should not be considered as advice to purchase or to sell mentioned securities. Data offered in this report is believed to be accurate, but is not guaranteed.
-
I know Mike is a very solid investor and respect his opinions very much. So if he says pay attention to this or that - I will.
~ Dale G.
-
I've started managing my own investments so view Michael's site as a one-stop shop from which to get information and perspectives.
~ Dave E.
-
Michael offers easy reading, honest, common sense information that anyone can use in a practical manner.
~ der_al.
-
A sane voice in a scrambled investment world.
~ Ed R.
Inside Edge Pro Contributors

Greg Weldon

Josef Schachter

Tyler Bollhorn

Ryan Irvine

Paul Beattie

Martin Straith

Patrick Ceresna

Mark Leibovit

James Thorne

Victor Adair