
Investment/Finances
Exclusive Money Talks Special Bonus: Mark Leibovit’s VRGoldLetter on the Gold Rally, Forecast, Metals Watch List, Portfolio Update & More – Email us at info@moneytalks.net to receive this report.
Mark Leibovit: On June 20 I wrote: “A Look At Silver – Awaiting A New Buy Signal”. One week later on June 27, the headline of this letter read: “A Short-Term Top Is In – A Buying Opportunity Looms Ahead. On July 4, I wrote: “Looking For A July Low”. And on Wednesday, July 6, I sent out a bulletin entitled: “Silver Posts Positive VR Signal”.

This chart shows the detached housing prices for Vancouver, Calgary, Edmonton, Toronto, Ottawa* and Montréal.
In April 2011 Vancouver prices remained literally off the chart; I had to extend the Y axis. Vancouver, Toronto, Ottawa and Montreal all set new highs. Calgary prices zoomed 3.6% M/M but Edmonton remained flat. Despite the pricing energy and ability of sellers to coax bids at the high end, sales continue to fall as fewer and fewer buyers remain willing to transact (scorecard). Retail lenders raised rates in April; market risk is palpable. (*Ottawa are combined residential)
View a Larger Chart HERE.
Sign up for our Weekly Newsletter HERE.
“This has been one of the most “defining” decades in American history and perhaps, by extension, the history of the world”

As a result of ongoing geopolitical tensions as well and increasing global demand, the price of crude oil continues to trend higher. Over the past eight months, the cost of one barrel of crude oil has increased by over $40. With oil prices trending higher, it is not all that surprising to find that gasoline prices are following suit. Since the financial crisis lows at the end of 2008, the average US price for a gallon of unleaded has risen $2.18 per gallon. The only time when gasoline prices were higher than today was during a brief three-month period in mid-2007, just prior to the Great Recession.
What is Chart of the Day?
Chart of the Day is a world renowned email newsletter devoted to providing professional money managers, investment advisors and individual investors with exclusive charts on a variety of financial markets and indicators.
Send Me MY Free Chart of The Day: Click HERE
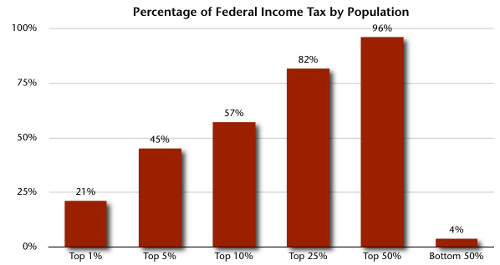
Source: Canada Revenue Agency HERE 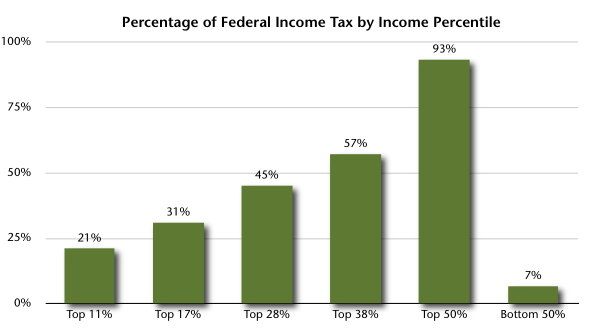
-
I know Mike is a very solid investor and respect his opinions very much. So if he says pay attention to this or that - I will.
~ Dale G.
-
I've started managing my own investments so view Michael's site as a one-stop shop from which to get information and perspectives.
~ Dave E.
-
Michael offers easy reading, honest, common sense information that anyone can use in a practical manner.
~ der_al.
-
A sane voice in a scrambled investment world.
~ Ed R.
Inside Edge Pro Contributors

Greg Weldon

Josef Schachter

Tyler Bollhorn

Ryan Irvine

Paul Beattie

Martin Straith

Patrick Ceresna

Mark Leibovit

James Thorne

Victor Adair