
Daily Updates
Exciting Weeks
It is always fascinating when different trading items get overdone just in time for an important reversal.
Signs Of The Times:
“Citigroup: Silver Could Retrace ’70s Bull. Rise to $100/Ounce”
– Barron’s, July 22, 2011
“Group of Seven Nations Pledge Every Action Necessary to Stabilize Markets”
-Bloomberg, August 8, 2011
By some measures financial volatility has become exceptional. Establishment economists have yet to understand that their interventions, which intend to stabilize, actually exaggerate private speculation. Official attempts to “manage” the economy have relentlessly made conditions more volatile.
Over the past three hundred years the highest yield for long-dated government issues in the senior currency was 6% set in 1797 when London was in a panic about a French invasion.
Long US Treasuries traded up to 15% (no typo) in 1981 when there was no threat of an invasion. From the late 1940s when the yield rose into the 3% level the Treasury started buying bonds out of the market in a vain attempt to keep rates from rising above 3%. In the 1960s the attempt became almost belligerent under the promotional label “Operation Twist”. The intention was to keep rates from rising through 6%.
The exercise issued so much credit/currency and dollar depreciation that rates has to soar – and they did.
In attempting to arbitrarily drive rates down, they drove them up.
Since the early 1900s, policymakers have been the greatest speculators in financial history. It’s been an invasion of idiosyncratic theory and practice.
“Wall Street aristocracy Got $1.2T in Loans”
– Bloomberg, August 21, 2011
The quip with the 1720 Bubble was that the traffic between the promoters and government had beaten a path from the office of the South Sea Company to the House of Commons.
Corruption was rampant then and now.
It is always fascinating when different trading items get overdone just in time for an important reversal.
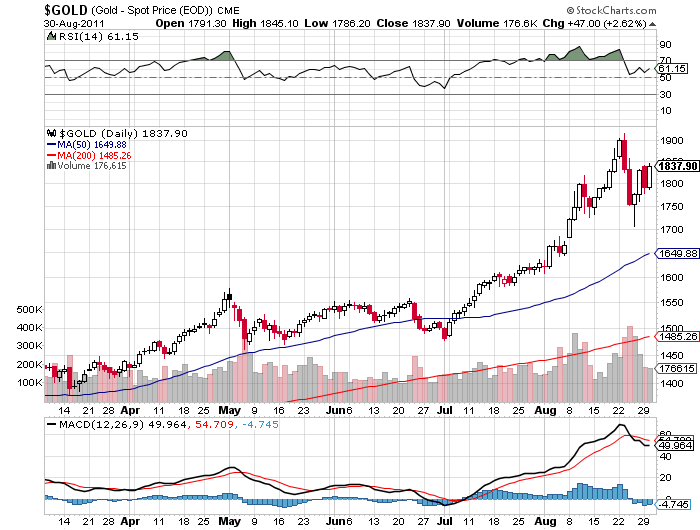
This time around it was gold bullion ETFs soaring to upside exhaustions in the time-window outlined by the ChartWorks at the June lows. This was refined in July for a targeted high for last week.
Last Thursday’s Pivot noted this and concluded that a “tradable decline is highly probable”.
The initial slump could run into next week.
The other excess was in the bond future, which registered some Upside Exhaustions – just as the play in gold was peaking.
This occurred as the stock market was getting poised for a bounce.
Ross’s work has again been timely and it is important to look at the longer term.
Bigger Picture
In January, our Momentum Peak Forecaster indicated that hot markets would surge to a speculative peak at around April. This worked out.
Using the similar example in 1973 – that recession started with the signal in November 1973. In the 1980 example, the recession started with the peak of speculation in January 1980.
In April we concluded that another recession would likely to have started in May. Events since seem to be confirming this melancholy prospect.
One of the most persuasive is widening credit spreads.
After a modest bounce to 55 at the first of the month, the sub-prime mortgage bond we follow has slumped to 45.0 – taking out the June low of 46.10.
Corporate spreads were expected to reverse to widening in May and they did. As noted last week, the trend has been set and the severity likely to be reached in the fall has arrived.
Spreads for Junk have widened from 619 bps in April to 1084 bps on Tuesday. That’s 70 bps of widening on the week.
Similarly, the High-Yield widened from 326 bps to 646 bps – out 40 bps on the week.
On Howard Green’s show on BNN (Canada’s CNBC) last week, Bob described the seriousness of the widening trend and the other interviewee belittled the point in noting that it was just spreads tied to the stock market. That would be Junk and High-Yield. He stated that there was little concern in investment-grade spreads.
Baa is investment grade and spreads have widened from 103 bps in April to 207 bps, which has been troubling to us.
Also, Libor continues the rise that began in June.
This is on schedule to a liquidity crisis in the fall.
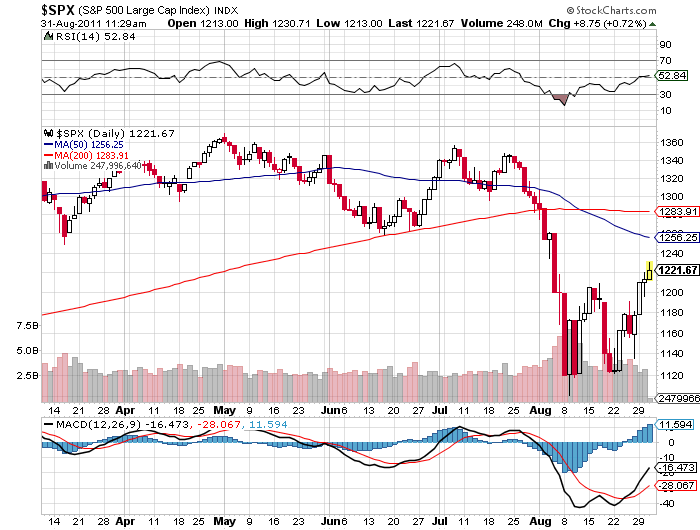
STOCK MARKETS
A brief rally into Labour Day has been possible and would provide another opportunity to sell.
As in 2007 and 2008, or at the peak of any stock market cycle, credit spreads are leading the way.
CURRENCIES
It was interesting that on July 22nd the DX was at 74.1 and the CRB at 347.9. Then the latter declined to 331.8 on Monday as the DX closed at 74.2.
The dollar did not rally as commodities sold off.
Also on July 22nd gold closed at 1599 and, with little change in the DX, rallied to 1900 on Monday.
On the same move, the 3-month bill rate declined from 0.0356% to 0.0025% on Monday.
Clearly, there was a flight of concerned money to the most liquid items, which continue to be T-bills in the senior currency and gold.
This has been an irrevocable step towards the next liquidity crisis.
Technically, the DX continues to work towards an intermediate rally.
On the longer term, the low of 72.7 was set at the end of April as the speculative surge in hot items completed. We took this as a cyclical peak for stocks and commodities, as well as a cyclical low for the dollar.
The cyclical high with the crash was 89.1 in March 2009.
Upon the next liquidity crisis, this would be a natural target.
This would, again, confound the absurd nexus of central bankers and gold bugs. Each believes that a currency can be depreciated – willfully and continuously. Going the other way, each liquidity crises provides an outstanding interruption.
COMMODITIES
Copper was expected to participate in the “surge” out to April and, along with the other metals, it did.
After a brief spike high to 4.60 in February, copper tested its high at 4.45 on April 8. This was also the high for our base metal index at 2053.
This was also the date for the high on the CRB at 368.7.
Prices generally declined to this week with copper at 3.98, base metals at 1661 and the CRB at 331.6.
Goldman’s base metal index (GYX) became oversold and the bounce started on Monday.
The relief rally can run into early September.
Agricultural prices continue to be roiled by unreliable weather, but the GKX set its high at 570 at the end of March. The oversold was at 450 in July.
The rebound has carried to 525 this week with the action approaching overbought.
This summer’s deteriorating credit conditions suggests that the April high for most commodities was a cyclical one. A cyclical bear seems likely.
WEDNESDAY, AUGUST 31, 2011
BOB HOYE
PUBLISHED BY INSTITUTIONAL ADVISORS
The above is part of Pivotal Events that was
published for our subscribers August 25, 2011.
Question: What asset has appreciated more than any asset since the year 2000? Answer: Farmland – by 1,200%! George Soros and Jim Rogers have recognized that fact and invested accordingly. Here is what you need to know to do likewise.
U.S. Stock Market – There’ s still plenty of cash burning a hole in the pockets of the “Don’t Worry, Be Happy” crowd, so the short term bottom I spoke of remains in force – for now. Light volume through Labor Day should only help to enhance this bounce, but any thought of this being the birth of a new bull market could be dangerous to your financial and mental well-being (similar to those poor Vancouver residents whose annual “this is our year” dream should be kicking in now).
Gold – The mother of all bull markets remains fully intact. It continues to eat up and spit out all market top and bubble forecasters. A four digit price with a “2” at the far left is quite possible before years-end.
U.S. Bonds – Shot gun loaded and waiting on a real drive below 2% on the 10-Year T-Bond for more than a moment or two to get short. Stay tuned.

U.S. Dollar – Continue to watch the 73.40 area on the U.S. Dollar Index. Two consecutive closes below that level should lead to a new low below 70 somewhere in the 1st quarter of 2012.

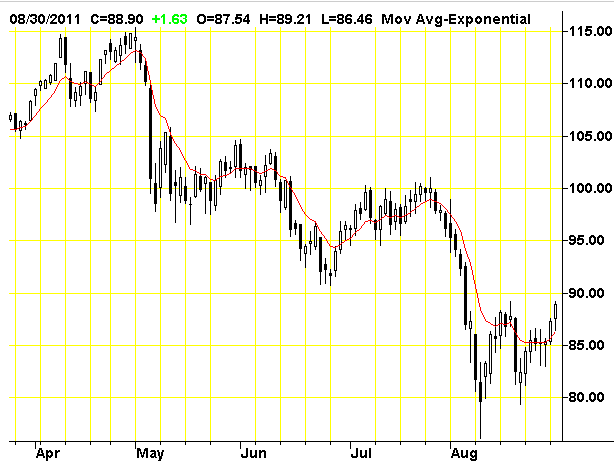
Oil and Natural Gas – I like oil at $75 or lower while natural gas is more compelling the further it gets under $4
How to Prepare for A Future Increasingly Defined By Localized Food and Energy
Ross Clark of Chartworks began his career in 1974 at the heart of the bear markets for the equities, a point in which technical analysis was in its infancy. Ross looks for signals that occur within a trend or a consolidation that are similar to ones that have occurred in the past. Money Talks interviewer Michael Levy has been following the gold markets since 1968 and thinks Clark’s calls on the gold market have been “phenomenal, and his work which facilitated those calls has been nothing short of spot on.”
A summary of Ross’s latest comments from his 12 pages of charts and analysis below:
- The rebound rally in silver following the high Silver/Gold ratio in April called for a rebound and ‘false breakout’ in the 15 to 18 week window. Once in place the high was to occur within one to three trading days. The ‘breakout’ occurred on Friday, August 21st and within 1 ½ days of the reversal. Look for a 62% retracement to $37.60.
- Summer rallies in gold that start early and make new highs for the year in July top out in 32 to 34 trading days (Now six times in forty years). This year took 35 days.
- Tops generally occur within three weeks of a weekly Upside Exhaustion alert. This one took 2 ½ weeks and was coupled with a daily reading in GLD on August 22nd.
- The correlation with the TBonds of 1998 (and the PEI cycle) called for a high around August 17th. Occurred within three trading days of the optimum date.
- Even in the most bullish market (1976 to 1980) gold paused at the upper resistance line in July 1979 using a semilog chart. This week reached the upper resistance line at $1900.
- Seasonal patterns have shifted this year with a high due now. A six week consolidation/correction is likely.
- The Gold/Oil ratio is at the top of a forty year channel, implying profitability for mining stocks, however the stocks could easily correct by 20% before the next advance get under way.
- The XAU/Gold ratio is bottoming and suggests that the next phase of the bull market in gold will see an improving participation by the mining stocks.
- The Dow/Gold ratio continues in the theme of a secular bear for equities and a bull market for gold.
View Ross Clark’s 12 pages of charts and various technical studies HERE
-
I know Mike is a very solid investor and respect his opinions very much. So if he says pay attention to this or that - I will.
~ Dale G.
-
I've started managing my own investments so view Michael's site as a one-stop shop from which to get information and perspectives.
~ Dave E.
-
Michael offers easy reading, honest, common sense information that anyone can use in a practical manner.
~ der_al.
-
A sane voice in a scrambled investment world.
~ Ed R.
Inside Edge Pro Contributors

Greg Weldon

Josef Schachter

Tyler Bollhorn

Ryan Irvine

Paul Beattie

Martin Straith

Patrick Ceresna

Mark Leibovit

James Thorne

Victor Adair