
Daily Updates
Though I am a long-term bull, Gold is signaling a potential move to 1000 or less and I am awaiting a clear buy signal to jump back into this market.
Ed Note: Below is a small excerpt from Mark Leibovit’s with a trading recommendation from the VRPlatinum Newsletter Letter.
GOLD and METALS – ACTION ALERT –
Though I am a long-term bull, Gold is signaling a potential move to 1000 or less and I am awaiting a clear buy signal to jump back into this market.
Precious metals fell sharply on Friday, especially platinum and palladium though gold recovered to close with just a small loss, as inflation concerns disappeared amid worries that the economy is weakening and as traders worried about demand, especially with commercial bank trading is under attack. Gold fell 1.60 to 1099.40, but traded as low as 1080.90. Silver fell 0.40 to 16.97. The effects of the new Platinum and Palladium ETFs have worn off. Platinum dropped 49 to 1547 and palladium declined 18 to 431.
Copper bounced back after hitting a new one-month low of 3.2670, settling up 0.0520 at 3.3470.
As I wrote last week, President Barack Obama’s proposed tougher bank regulations may result in less money flowing into commodities markets. This is hurting both metals and energy. Regardless, it is only temporary.
Special offer from Mark Leibovit for Money Talks only: The intense analysis of Gold in the 10-12 page The VR Gold Letter is right now 75% off for the first month or $29.95 (regularly $125.00 a month). The weekly VR Gold Letter focuses on Gold and Gold shares.Go HERE and use the Money Talks promo code CBC12210
STOCKS – ACTION ALERT –
Above I wrote: “A Rally First, But We’re Entering a Bear Market Year!” We’re clearly in a first-quarter correction, but, frankly, it came earlier than I expected. Normally, we would see the lows around mid-March. Perhaps this time cycles will invert, but we won’t know until we get there. Unless you’re inclined to play inverse ETFs or short, I told you in recent days that the best place was to be was in cash.
The Dow Industrials could very well decline another 1000 points from here (or more later), so you should be looking for entry points to play for a further short-term decline. Tuesday, is a potential ‘Turnaround Tuesday’, so the current downleg may hit a wall then, however, until we get a clear sign of a bottoming process, let’s be patient.
The stock market got crushed on Friday, falling for the third consecutive day, after earnings reports came in mixed, with GE and McDonald’s exceeding expectations, but Google, American Express, and Capital One disappointing. Misguided political proposals are also weighing on the market. The bulls tried to lift the market before noon on Friday, but the bears won out and the stock market finished at the lows of the day. The Dow fell 216.90 or 2.09% to 10,172.98. The S&P lost 24.72 or 2.21% to 1091.76. The NASDAQ declined 60.41 or 2.67% to 2205.29.
Weighing on the market Friday was news that the Democrats may not have the votes to reconfirm Ben Bernanke as Federal Reserve Chairman. While I certainly support non-confirmation of Bernanke and favor complete elimination of the Fed, as you already know, there is no denying that these things would be bad for the stock market in the short term.
The market also remained under pressure by Thursday’s announcement from President Obama of plans to limiting the amount of risk large banks could take, thus prohibiting commercial banks from trading. Financials (XLF) fell another 3.26% Friday after declining 2.85% on Thursday. Financials were also weak after disappointing earnings from American Express and Capital One (see earnings section below).
Technology (XLK -3.48%) was the biggest loser on Friday after disappointing earnings from Google and AMD (again, see earnings section below).
All the major market indexes are now below their 50-day moving averages. Only the small and mid cap indexes (Russell 2000, S&P 600, and S&P 400) are above that key level. Eight of the nine market sectors are trading below their 50-day moving averages.
Earnings have been strong so far this season. Revenues have been as well, though not as strong. At Thursday’s close, 70 of the companies in the S&P 500 Index had reported fourth-quarter results, with 79% beating expectations for the bottom line, 3% matching and 19% falling under consensus forecasts. The 79% figure is unusually high, compared with the 15-year average of 61% of S&P 500 companies topping expectations. If that 79% holds through to the end of the reporting season, it would tie the record-high percentage tallied in the third quarter. Of the 69 companies that reported revenue numbers, 65% topped expectations; none matched and 35% offered results that came in below estimates. As a result, it is aforementioned politics that is hurting the stock market.
Mark Leibovit’s forecast at the World Outlook Conference Jan 22, 23rd available HERE.
![]()

The weekly VR Gold Letter focuses on Gold and Gold shares. The letter is available to Platinum subscribers for only an additional $50 per month and to Silver subscribers for only $70 per month. Email me at mark.vrtrader@gmail.com.
Special offer from Mark Leibovit for Money Talks only: The intense analysis of Gold in the 10-12 page The VR Gold Letter is right now 75% off for the first month or $29.95 (regularly $125.00 a month). Go HERE and use the Money Talks promo code CBC12210
Marks VRTrader Silver Newletter covers Stock, TSE Stocks, Bonds, Gold, Base Metals, Uranium, Oil and the US Dollar.
More kudos – Mark Leibovit was named the #1 Intermediate Market Timer for the 10 year period ending in 2007; the #1 Intermediate Market Timer for the 3 year period ending in 2007; the #1 Intermediate Market Timer for the 8 year period ending in 2007; and the #8 Intermediate Market Timer for the 5 year period ending in 2007. NO OTHER ANALYST SURVEYED APPEARED IN ALL FOUR CATEGORIES FOR INTERMEDIATE MARKET TIMING AS PUBLISHED IN TIMER DIGEST JANUARY 28, 2008!
For a trial Subscription of The VR Silver Newsletter covering Stocks, Bonds, Gold, US Dollar, Oil CLICK HERE
The VR Gold Letter is available to Platinum subscribers for only an additional $20 per month, while for Silver subscribers the price is only an additional $70.00 per month. Prices are going up very shortl, so act now! Separately, the VR Gold Letter retails for $1500 a year! The VR Gold Letter is published WEEKLY. It is 10 to 16 pages jam-packed with commentary and charts. Please call or email us right away. Tel: 928-282-1275. Email: mark.vrtrader@gmail.com .
Some startling forecasts from the Finest Calibre of Independent Financial Analysts available online from Money Talks World Outlook Financial Conference HERE.
![]()
After the historic boom, is gold price climbing down to $1,000 per ounce, to confirm to the controversial prediction that noted economist Nouriel Roubini made some weeks back? It looks so as gold is going bearish, in the weight of economic nervousness coming from the two important countries that matter—United States and China.
Now, as gold sank to a three-week low on Friday across the global markets and commodity bourses, some bullion analysts warned that gold price could plunge below $1,000 per ounce if the talks on property bubbles from China and financial risk taking concerns in the US are going to intensify.
“Gold is on a bearish mood these days after the precious metal’s spectacular ascent to the record high of $1,227 per ounce in November last year. Gold price may not boom above $1,227 this year, if commodities get into a slump in 2010. A crash in gold price below $1,000 per ounce can not be ruled out,” said Mark Robinson, a bullion analyst based in Dubai.
According to Robinson, the main problem with gold is that “its price has been over-hyped by some bullion analysts and forecasters.” “It is funny to see so many gold predictions going around in the search engines on the Internet. Gold price is being predicted from $1,000 per ounce up to a whopping $5,000 and even $10,000 by analysts and investors ranging from Jim Rogers, Marc Faber and Nouriel Roubini to research assistants in small broking firms,” Robinson told Commodity Online.
While Robinson agrees that gold is the most valuable asset among commodities and the yellow metal is arguable the best investment asset class in the world, he points out: “But there is so much hype going on in the bullion market on gold price. The hype lacks basic fundamentals like gold mine supply, demand and possible emergence of other commodities like platinum, palladium and silver as equality challenging investments like gold.”
But, all said and done, what are the real reasons that are prompting investors and bullion traders to press the panic button on gold price?
There are three immediate reasons why gold price is plunging.
….read page 2 HERE
Editor Note: Money Talks highly recommends that you make a regular trip to this monday morning site to this Don Vailoux monday report where he analyses an astonishing 40 to 50 Stocks, Commodities and Index charts and, provides a “Bottom Line” and some very interesting commentary.
Be sure to check out Don Vialoux’s Long Term Forecast at January 22,23rds
![]()
U.S. equity index futures are higher this morning. S&P 500 futures are up 6 points in pre-opening trade. Futures are responding to comments over the weekend by members of Congress and the White House assuring bi-partisan support for the renomination of Ben Bernanke as chairman of the Federal Reserve. The Senate must approve the renomination by January 31st.
The U.S. Dollar weakened on the news. The weaker U.S. Dollar triggered strength in commodities priced in U.S. Dollars. Gold, silver, copper, platinum and crude oil are trading higher. The U.S. Dollar has found short term resistance at its 200 day moving average.
AK Steel added 5% after reporting higher than consensus fourth quarter earnings. The company continues to benefit from rising steel prices.
Apple added 2%. Traders are anticipating launch of Apple’s tablet on Wednesday.
Goldcorp added 1% following an upgrade from Hold to Buy by TD Newcrest. Target price is $50.
Thomson Reuters improved 1% following an upgraded by Citigroup from Hold to Buy.
Bank of Nova Scotia was upgraded by Macquarie from Neutral to Outperform.
Economic News This Week
Focus this week is on the Federal Reserve Open Market Committee (FOMC) meeting on Wednesday and preliminary U.S. fourth quarter GDP on Friday.
January Consumer Confidence to be released at 10:00 AM EST on Tuesday is expected to slip to 52.9 from 53.3.
December New Home Sales to be released at 10:00 AM EST on Wednesday is expected to increase to 370,000 from 355,000.
News from the FOMC meeting is scheduled to be released at 2:15 PM EST on Wednesday. No change in administered rates (i.e. Fed Fund rate) is expected.
January Durable Goods Orders to be released at 8:30 AM EST on Thursday is expected to increase 2.0% versus a gain of 0.2% in December.
Fourth quarter real GDP to be released at 8:30 AM EST on Friday is expected to grow at a 4.5% annualized rate versus a gain of 2.2% in the third quarter.
January Chicago PMI to be released at 9:45 AM EST on Friday is expected to slip to 56.0 from 58.7 in December.
January University of Michigan Sentiment Index is expected to improve to 73.0 from 72.8 in December.
Earnings News This Week
U.S. fourth quarter earnings reports pour in this week. Canadian earnings reports start to trickle in. Following is a list of prominent companies scheduled to report and their expected report dates:
Monday sees a report from Union Pacific
Tuesday sees Baker Hughes, Canadian National Railway, Dupont, Johnson & Johnson, Nucor, Travelers and U.S. Steel, Verizon and Yahoo.
Wednesday sees Abbott Labs, AGF, Boeing, Canadian Oil Sands Trust, Caterpillar, Celestica, CGI Group, Conoco Phillips, Illinois Tool Works, Methanex, Norfolk Southern and United Technologies.
Thursday sees MMM, AT&T, Becton Dickenson, Bristol Myers, Canadian Pacific, Colgate, Eli Lilly, Lockheed Martin, Microsoft, Potash Corp and Procter & Gamble.
Friday sees Chevron and Honeywell.
Equity Index Trends
The ratio of S&P 500 stocks in an uptrend to a downtrend (i.e. the Up/Down ratio) plunged last week from 5.77 to (344/81=) 4.25 (including 38 stocks that broke support on Friday). The ratio has rolled over and established an intermediate downtrend.
P.S. This Up/Down ratio is a preliminary estimate and does not include our regular due diligence. An exact figure will be offered tomorrow. Ditto for the TSX Up/Down ratio!
Bullish Percent Index for S&P 500 stocks dropped last week from 83.00% to 77.00% and fell below its 15 day moving average. The Index remains intermediate overbought and appears to be forming an intermediate downtrend.
Ed Note: 5 of the 41 Charts Canada’s Great Technical Analyst Don Vialoux analyses and comments on HERE (scroll down)
The Dow Jones Industrial Average fell 436.67 points (4.12%) last week. It also fell below its 50 day moving average and broke below its intermediate uptrend line. Short term momentum indicators have rolled over from overbought levels and are trending lower. Stochastics already are short term oversold, but has yet to show signs of bottoming. Seasonal influences are positive. Strength relative to the S&P 500 Index remains negative. Intermediate downside risk is to support at 9,679.
The TSX Composite Index lost another 341.94 points (2.93%) last week. It already has fallen 6.0% from its peak set on January 11th. Last week, it broke below its 50 day moving average and its intermediate uptrend line. Short term momentum indicators are trending lower from intermediate overbought levels. Stochastics and RSI already are short term oversold, but have yet to show technical signs of bottoming. Seasonal influences remain positive. Strength relative to the S&P 500 Index remains negative.
The Shanghai Composite Index fell 95.57 points (2.96%) last week. It fell below its 50 day moving average and below a seven month triangle pattern. Support is at 3,040. Short term momentum indicators have rolled over from an overbought level. Stochastics already are short term oversold, but have yet to show signs of bottoming. Strength relative to the S&P 500 Index remains neutral.
The Canadian Dollar fell 2.64 points last week mainly because of declining commodity prices. On Friday, it broke below its 50 day moving average. Support is indicated at 92.16. Short term momentum indicators are trending lower. Stochastics already are short term oversold, but have yet to show signs of bottoming.
Seasonal influences on the Canadian Dollar relative to the U.S. Dollar turn negative from January to March. They turn positive thereafter. Following is a chart offered by Brooke Thackray showing seasonality of the Canadian Dollar relative to the U.S. Dollar from 1971 to 2009. Strongest month for the Canadian Dollar is the month of April.
….more charts at Don Vailoux‘s monday report HERE
Don Vialoux has 37 years of experience in the Investment Industry. He is a past president of the Canadian Society of Technical Analysts (www.csta.org) and a former technical analyst at RBC Investments. Don earned his Chartered Market Technician (CMT) designation from the Market Technician Association in 1995. His CMT paper entitled “Seasonality in Canadian Equity Markets” was published in the Spring-Summer 1996 edition of the MTA Journal. Don also has extensive experience with Exchange Traded Funds (also know as Index Participation Units) as well as conservative option strategies. In 1990 he wrote a report that was released in the International Federation of Technical Analyst Journal entitled “Profiting from a Combination of Technical and Fundamental Analysis”. The report introduced ” The Eight Phases of the Stock Market Cycle”, an investment concept that continues to identify profitable entry and exit points for North American equity markets. He is currently a member of the Toronto Society of Fundamental Analyst’s Derivatives Committee. Now he is the author of a daily letter on equity markets available free on the internet. The reports can be accessed daily right here at www.dvtechtalk.com.
The Weak-end Trading Report
It’s been a crazy week for stock and futures traders as the market moved up and down like a yo-yo, finally closing down sharply on the week.
Earlier this week I posted a report showing the Volatility Index (VIX) and how it was then trading at an extreme low level which triggered the sharp market corrections. Since that post the VIX has now risen over 30% as traders start selling positions to lock in gains.
Take a quick look at the Volatility Index chart:
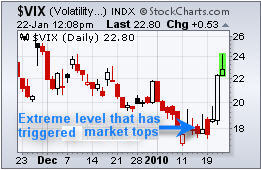
Chart of S&P500 Daily Price Action
Since the low in the volatility index a few days ago we have seen the S&P500 drop over 3.4%. This sharp sell off in equities and ES futures has happened in a very short period of time making the overall market oversold when looking at short time frame of the daily chart. With the market oversold and also trading near a support level I expect we could get a weak bounce lasting 1-5 days before rolling over for another wave of selling.
There are several reasons I feel this will happen:
1. Experience from seeing setups/patterns like this across many different indexes and investment vehicles leads me to believe distribution of shares are now starting to flood the market.
2. The market sentiment surveys are still extremely bullish. What does this mean? Well if almost everyone is bullish, then who is left to buy?
3. As the good old saying goes “Buy the Rumor, Sell the News”. With earning season starting I cannot help but think everyone (smart money) will be selling into the good earnings news as dumb money buys into stocks as they meet or beat earnings. This inflow of dumb money is exactly what the big guys need to unload massive amounts of shares at a premium. Also I would like to point out that earning estimates have been very low that past year which I think has been on purpose for the institutions. This makes it very easy for companies to beat estimates each quarter giving the warm cozy feeling to retail investors (us, the small guys)
4. Also Chares Biderman on Bloomberg pointed out the other day that the market looks to be manipulated by the feds as virtually all the gains have been produced after hours in the futures market.
Chares Biderman Video
The United States in my opinion is much more corrupt than most people think and I don’t really want to get into this rather large and interesting debate at the moment. But Charles Biderman has some very interesting points which fall in line with my thinking about how much of what is happening is really natural and what is completely manipulated in the past 10 months of rising market prices.
Must Watch 5 Minute Video
Quick Technical Chart Update on Gold
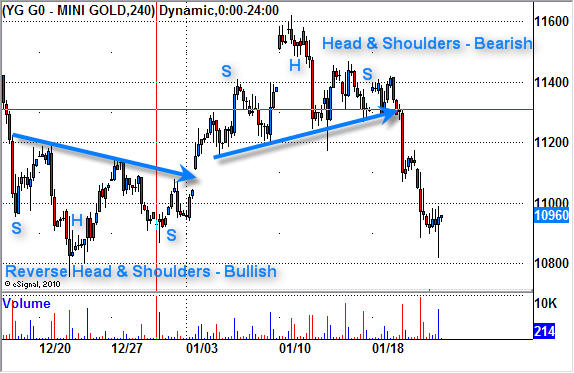
I thought this chart may be of interest to some of you as it shows two perfect textbook plays on the 4hr gold futures trading chart.
As you can see the first pattern is a reverse head & shoulders pattern. This is bullish and a breakout above the neckline would signal a buy point. Now if we use basic technical analysis with this pattern we can measure the potential move up by looking reverse head and shoulders pattern. You take the low of the upside down head $1075, and go straight up to the neckline at $1117. That is a total of $42. So if we add that $42 to the breakout point above the neckline then we can have a price target of $1117 + $42 = $1159.
As we can see the price of gold over the next couple days rallied to the $1160 level. Trading is not that easy but that is how it works in general. The hard part is knowing how to manage your trade and I scale out of positions as the price matures reaching short term resistance levels and by adjusting my stops accordingly to lock in maximum gains while minimizing downside risk.
A couple days later the same chart formed a regular Head & Shoulders and has since moved its potential measured move. I m not expecting a weak bounce in gold as with the overall stock market, but I am still not sure that the selling is over.
The “Weak’end Trading Conclusion:
In short, the market was turned upside down this week. Those who follow me should be in cash or mostly in cash as this drop was anticipated a few days ago.
Trading during fast moving markets is much tougher for swing traders as pivot points for indexes and commodities tend to happen during the intraday or during futures trading at night. High volatility like this is fantastic for active traders who focus on shorter time frames like the 4hr and 60minute charts, as opposed to trading just the daily chart and entering and exiting positions at the open and close each day.
I continue to watch the market and plan on providing some of these short term setups on the 4 hr chart using both the GLD etf gold fund and the YG Gold futures mini contract.
If you are interested in Trading Gold Futures and other contracts please join my Free Futures Trading Newsletter:
Chris Vermeulen is the founder of TheGoldAndOilGuy newsletter. “I provide you with unparalleled trading newsletter with charts, signals and email support. Unlike other investing newsletters, I’m a one man show. That’s because I don’t want some hired hand giving you advice while I take it easy on a beach somewhere. You ALWAYS get precise, valuable information DIRECTLY from ME.“
Choosing Dividend Stocks: Six Steps For Finding These Safe, High-Yield Investments
The latest tally from famed professor, Jeremy Siegel – author of the investing classic, Stocks for the Long Run – proves that dividend stocks are still the best investment. Period.
The latest tally from famed professor, Jeremy Siegel – author of the investing classic, Stocks for the Long Run – proves that dividend stocks are still the best investment. Period.
Yet everyone still loves to dog them for being boring and slow growers.
Big mistake.
Let me prove to you just how profitable dividend stocks can be – and then show you how to find the safest, highest-yielding investments in this market.
…..read more HERE
-
I know Mike is a very solid investor and respect his opinions very much. So if he says pay attention to this or that - I will.
~ Dale G.
-
I've started managing my own investments so view Michael's site as a one-stop shop from which to get information and perspectives.
~ Dave E.
-
Michael offers easy reading, honest, common sense information that anyone can use in a practical manner.
~ der_al.
-
A sane voice in a scrambled investment world.
~ Ed R.
Inside Edge Pro Contributors

Greg Weldon

Josef Schachter

Tyler Bollhorn

Ryan Irvine

Paul Beattie

Martin Straith

Patrick Ceresna

Mark Leibovit

James Thorne

Victor Adair