
Daily Updates
The Bottom Line
Chances are high that a shallow correction from a short term overbought level has started in North American equity markets. Preferred strategy is to purchase equities and Exchange Traded Funds on a pull back in sectors with favourable seasonality including silver, platinum, mines & metals, oil services, energy and materials.
A 7 chart sampling below of the 45+ Charts Don Vialoux analyses in this great Monday comment HERE.
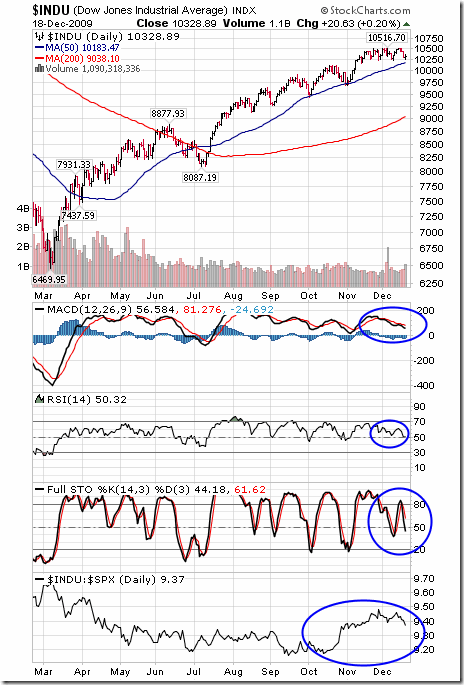
The Dow Jones Industrial Average gained 117.29 points (1.10%) last week. An intermediate uptrend continued on a break above resistance at 10,741.98. Support is indicated at 9,835.09. Short term momentum indicators are overbought, but continue to trend higher. Strength relative to the S&P 500 Index remains negative. Seasonal influences remain favourable. Current intermediate upside potential is to 11,600. Current intermediate downside risk is to its 50 day moving average at 10,400.40.
The TSX Composite Index eased 65.84 points (0.55%) last week. An intermediate uptrend continued on a break above resistance at 12,070.20. Support is at 10,990.41. Short term momentum indicators are overbought and showing early signs of rolling over. Strength relative to the S&P 500 Index remains neutral. Seasonal influences remain positive. Current intermediate upside potential is to 12,500. Current intermediate downside risk is to its 50 day moving average at 11,647.03.
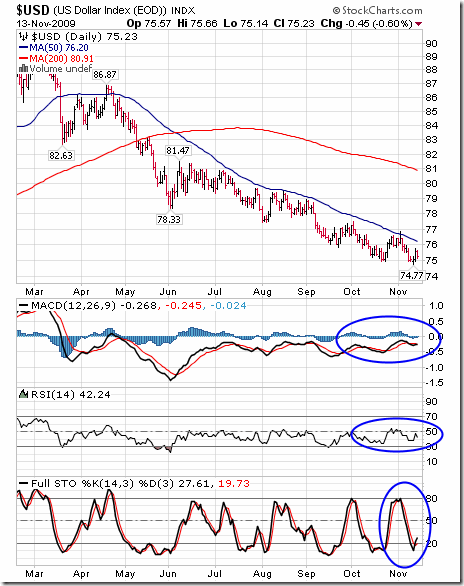
The U.S. Dollar Index added 0.94 last week. Strength on Thursday and Friday was triggered by weakness in the Euro. Resistance levels are at 81.34 and 81.47. The Index bounced from its 50 day moving average. MACD and RSI continue to trend lower from short term overbought levels. Stochastics are recovering from an oversold level. Intermediate downside risk is to the top of a previous trading range at 78.45.
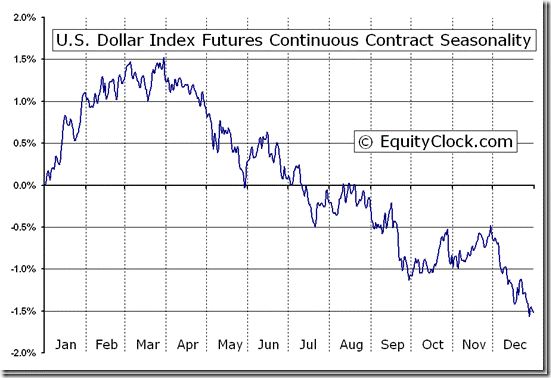
Seasonal influences on the U.S. Dollar tend to peak in March and trend lower thereafter. Following is a 20 year seasonality chart courtesy of www.equityclock.com
Political events could have a significant impact on the U.S. Dollar in the months ahead. Recent actions by members of the U.S. Congress against China potentially could lead to an international trade and finance crisis later this year. Last Monday a group of 130 Democrat and Republic lawmakers petitioned Treasury Secretary Timothy Geithner to brand China a “currency manipulator” when he releases a report on the subject in April. The lawmakers are saying that the Chinese are in effect subsidizing exports by maintaining a low value of the Chinese currency relative to the U.S. Dollar. Under legislation proposed by lawmakers the Treasury Department is required to indentify countries with “fundamentally misaligned currencies” and to issue a “priority action” against them. Countries on the “priority” list could face a range of U.S. responses including a revision to dumping calculations, a halt in government purchases of goods and services and a restriction on trade finance and insurance. A prominent U.S. media spokesman said last week that the actions by Congressional members are equivalent to “poking a stick in the eye of your banker”. The lawmakers seemed to have forgotten that China is the largest holder of U.S. Treasury securities and, until late last year were the largest purchaser of Treasury issues used to finance the U.S. government’s mounting budget deficit. China owns more than $700 billion of U.S. Treasury securities. The Chinese already are responding to a growing protectionist stance taken by Congress. The February Treasury International Capital Systems (TICs) report released last week revealed that China was a net seller of U.S. Treasuries for the third consecutive month. Relations between China and the U.S. have deteriorating significantly in recent weeks due to a series of issues including the U.S. sale of weapons to Taiwan, the threat to Google’s presence in China and cyber attacks reportedly initiated in China. Chinese efforts to liquidate even a small portion of their Treasury securities could place significant downside pressure on the U.S. Dollar.
The Canadian Dollar added 0.28 last week. Short term momentum indicators are overbought and showing early signs of rolling over. Current intermediate downside risk is to its 50 day moving average at 95.87. Current intermediate upside potential is to 103.75.
Gold added $4.60 U.S. per ounce last week despite a $20.40 U.S. per ounce drop on Friday. The drop on Friday was related to strength in the U.S Dollar. Short term momentum indicators are neutral. Strong support and its 200 day moving average are at $1,044 U.S. per ounce
Seasonal influences at this time of year are random. Following is a 20 year seasonality study recently completed by www.equityclock.com

Go view the commentary and the 45+ Charts Don Vialoux analyses in this great Monday comment HERE.
Don Vialoux has 37 years of experience in the Investment Industry. He is a past president of the Canadian Society of Technical Analysts (www.csta.org) and a former technical analyst at RBC Investments. Don earned his Chartered Market Technician (CMT) designation from the Market Technician Association in 1995. His CMT paper entitled “Seasonality in Canadian Equity Markets” was published in the Spring-Summer 1996 edition of the MTA Journal. Don also has extensive experience with Exchange Traded Funds (also know as Index Participation Units) as well as conservative option strategies. In 1990 he wrote a report that was released in the International Federation of Technical Analyst Journal entitled “Profiting from a Combination of Technical and Fundamental Analysis”. The report introduced ” The Eight Phases of the Stock Market Cycle”, an investment concept that continues to identify profitable entry and exit points for North American equity markets. He is currently a member of the Toronto Society of Fundamental Analyst’s Derivatives Committee. Now he is the author of a daily letter on equity markets available free on the internet. The reports can be accessed daily right here at www.dvtechtalk.com.
Weekly Gold, Silver, Oil & Natural Gas Analysis
March 21, 2010
Last week was nothing special as stock market continued to drift higher on light volume and the Volatility Index (VIX) reaching a new multi year low. This mix of higher prices on light volume, multi year lows in the VIX and an overbought market paints a clear picture to a market technician – Be Ready for a Pullback!
Last Wednesday I sent out a report covering sector rotation comparing the price performance of these sectors from the January peak with last weeks price action. It was very interesting and it pointed to a sharp sell off Thursday or Friday
Here is last Wednesday’s report if you are interested: HERE
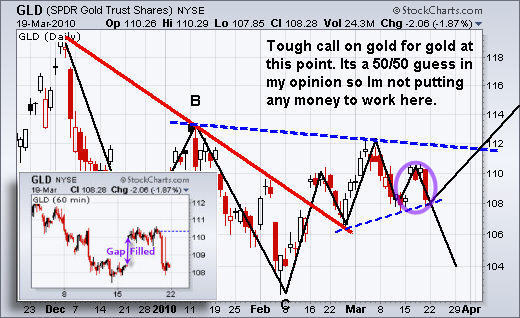
GLD Gold ETF Daily & 60 Minute Chart
Last week gold gap higher then traded sideways for a few days. I will admit it was very tempting to buy into the move but I stuck with my trading strategy which is to not chase moves which gap in my direction.
Gaps are known to get filled about 70% of the time. What that means in this situation is that the price will most likely sell back down to fill that gap before trying to move higher.
All that said the problem I see now on the daily chart is the possibility of the mini Head & Shoulders pattern breaking down. If gold moves any lower then I would expect a sharp pullback. The measured move would equal a pullback to the $104 area on the GLD chart and the $1070 level for spot gold.
SLV Silver ETF Trading Chart
The silver chart looks much different than gold’s but in reality they are trading in a similar situation. If silver moves any lower then sellers will flood the market and take the price down to the next support level. But if we get a bounce then it should surge and rally almost a $1 per ounce from this point.
Only time will tell as we let this trade unfold with a stop at $16.52.

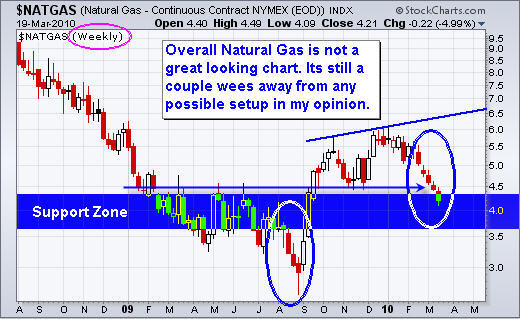
Natural Gas – Weekly Trading Chart
Natural gas has been selling down for almost 2 months. The chart is starting to show a possible buy point if all goes well in the next few weeks.
What I like about this chart is that we saw a break of a support level and heavy selling which tells me the general herd is getting shaken of their long positions. This extended sell off is now entering a support zone and could provide us with a low risk setup in the next 2-3 weeks.
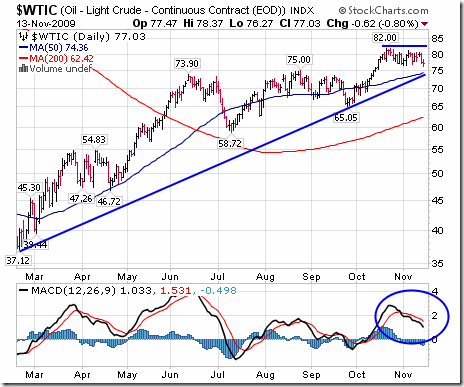
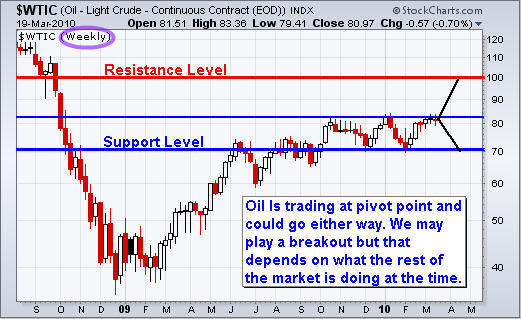
Crude Oil – Weekly Trading Chart
Oil is trading similar to gold and silver. It is trading at a key pivot point and could go either way quickly. I will be keeping my eye on the daily and 60 minute charts for a possible low risk entry point.
Weekend Stock & Commodity Trading Conclusion:
In short, the overall market is trading at level were there is not much to we can do. Day traders are able to take advantage of this price action but not swing traders.
I feel the major indexes have another 1-2 down day left in them before a bounce, but it’s more difficult to gauge the momentum with a cool down period in the middle of it all (the weekend).
The market is on the edge of some exciting moves as I can feel something brewing. With any luck there could be some great opportunities in the coming days.
If you would like to receive my Free Weekly Trading Reports checkout my website: www.GoldAndOilGuy.com
From Chris: I truly believe this is the perfect trading service for active traders who want a conservative yet highly profitable trading strategy. The GLD Gold exchange traded fund allows for very accurate signals when used along with the price of gold, HUI, USD, bullish percent charts and gold stocks. I also focus on Oil, Silver, Index & Sector ETFs when opportunities present them selves. When these different investments are used in conjunction with technical analysis and my proven trading strategy, trades become very CLEAR and SIMPLE to execute. My trading strategy eliminates your emotions and makes trading extremely accurate with very little downside risk.
Special offer from Mark Leibovit for Money Talks only: The intense analysis of Gold in the 10-12 page The VR Gold Letter is right now 75% off for the first month or $29.95 (regularly $125.00 a month). The weekly VR Gold Letter focuses on Gold and Gold shares.Go HERE and use the Money Talks promo code CBC12210

ACTION ALERT:
Traders are either in cash or short awaiting a renewed trading signal to get long gold. Though I am attempting to give the upside the benefit of the doubt vis a vis the Annual Forecast Model, time is running out. If we get a clear buy signal, I will jump back in and notify you with the view that should be looking for an intermediate top.
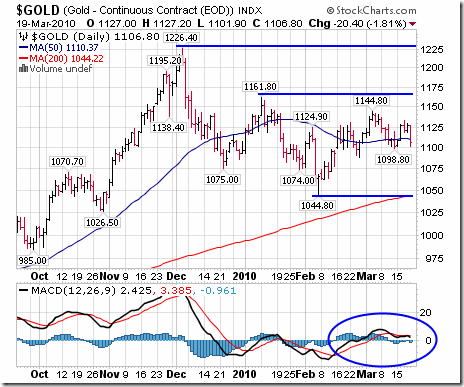
Precious metals rallied on Monday and Tuesday but then fell on Wednesday and Friday to finish the week nearly unchanged. Most interesting, the stock market also rallied early last week before declining at the end of the week. And the Dollar declined early last week before rising the last couple of days. So, stocks and precious metals seem to be trading together, inversely to the Dollar. However, notice that metals finished near unchanged for the week despite the rise in the US Dollar. Obviously, there is more to the precious metal story than the Dollar. Fears over the Greek credit crisis and credit troubles in a number of other countries are obviously providing a base for gold.
With fears over credit coming from Greece and around the world on one side and a strong Dollar, for now, on the other, gold is caught in a trading range of approximately 1100-1140. Last week, gold bullion traded as high as 1134.40 and as low as 1100.50, closing at 1107.90, up 6.40 from the previous week. All this while the US Dollar Index rallied 0.959. Silver though fell 0.11 to 16.96, platinum remained unchanged at 1605, palladium rose 4 to 465, and copper declined 0.0075 to 3.3725.
On Thursday, volatility in the price of gold fell to its lowest level in seven months based on the CBOE Gold Volatility Index. Friday’s sharp decline in gold lifted the Volatility Index off those lows, but it still remains very low by historical standards. Volatility was last in August 2009, right before gold rallied from the 950 level to over 1200.
The weekly VR Gold Letter focuses on Gold and Gold shares. The letter is available to Platinum subscribers for only an additional $50 per month and to Silver subscribers for only $70 per month. Email me at mark.vrtrader@gmail.com.
Special offer from Mark Leibovit for Money Talks only: The intense analysis of Gold in the 10-12 page The VR Gold Letter is right now 75% off for the first month or $29.95 (regularly $125.00 a month). Go HERE and use the Money Talks promo code CBC12210
Marks VRTrader Silver Newletter covers Stock, TSE Stocks, Bonds, Gold, Base Metals, Uranium, Oil and the US Dollar.
More kudos – Mark Leibovit was named the #1 Intermediate Market Timer for the 10 year period ending in 2007; the #1 Intermediate Market Timer for the 3 year period ending in 2007; the #1 Intermediate Market Timer for the 8 year period ending in 2007; and the #8 Intermediate Market Timer for the 5 year period ending in 2007. NO OTHER ANALYST SURVEYED APPEARED IN ALL FOUR CATEGORIES FOR INTERMEDIATE MARKET TIMING AS PUBLISHED IN TIMER DIGEST JANUARY 28, 2008!
For a trial Subscription of The VR Silver Newsletter covering Stocks, Bonds, Gold, US Dollar, Oil CLICK HERE
The VR Gold Letter is available to Platinum subscribers for only an additional $20 per month, while for Silver subscribers the price is only an additional $70.00 per month. Prices are going up very shortl, so act now! Separately, the VR Gold Letter retails for $1500 a year! The VR Gold Letter is published WEEKLY. It is 10 to 16 pages jam-packed with commentary and charts. Please call or email us right away. Tel: 928-282-1275. Email: mark.vrtrader@gmail.com .
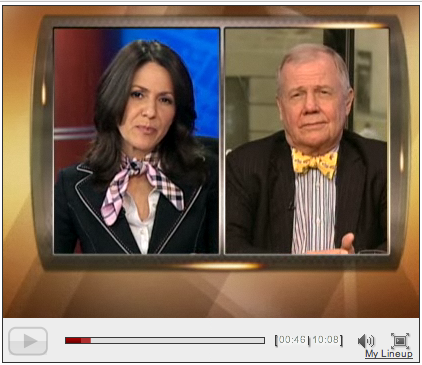
He’s considered to be one of the world’s savviest investors. Jim Rogers, chairman, Rogers Holdings, tells BNN which commodities he would buy if he had $100,000 to spend.
Is it Better To Buy Gold Bullion Or Gold Shares?
This is a snippet from the Gold Forecaster. The newsletter that covers all pertinent factors affecting the gold price [with a 95% accuracy rate].-
Global equity markets have changed over the last three years, investor capacities and capabilities have changed as have interest rate patterns. This makes it incumbent upon investors to re-examine this question from the ground up.
The value of Dividend Yields
In the days of yesteryear, long-term investors bought shares because of growth potential and in particular for the income they would earn from shares and its growth. The share price would then focus on dividends and potential dividends rising or falling in line with such growth or lack thereof. Capital appreciation would follow. Present and future Dividend Yield was usually tempered [as was the share price] in the booms and busts, by relating it to the average 5 to 10 year fixed interest rate yield. This was because one had to ask, what would the advantage be in investing in risky equities, when one had the benefit of risk-free fixed interest securities. The potential of the equity shares could then be related to the state of the economy insofar as it related to interest rates.
We now maintain that such value assessments should come out from yesteryear and find their place in today’s portfolios. With the baby boomer generation reaching retirement now, their Pension funds have to switch to paying out regular amounts to this group, while the current far smaller group of future pensioners are not contributing sufficient amounts to these funds, to allow their payments to service this growing bulge of pensioners now retiring. The shortfall will have to come from the income stream of investments.
Earnings don’t Count
Then the optimism of the early eighties grew and a culture of earnings don’t count came onto the scene. The workforce contributions to future pensions was far more than enough to service existing pensioners and still contribute to the capital for investment into the funds. This allowed institutional investors to ignore a clear income stream to investors and to focus entirely on capital growth reflecting the growing size of the investment. This assumed that share prices would reflect this growth and make any income stream irrelevant. Investors have bought into this and did so right through the summer days of the markets from the early eighties to 2007. In many, many cases this led to price earnings ratios to rise to well above 30 times.
If we refer back to the Earnings concept, this meant that the company’s share price was discounting 30 years worth of earnings a very rosy view of the future and potential growth. Ah, you may well counter, the value of each share would rise higher than any such concept, so would justify such a view. And if we lived in a world where summer was perpetual, this would be true. But the winter of August 2007 changed all that.
We now need a share for all seasons and that brings us back to scene where shares should be bought that will do well in bad days and grow in value [followed by price], in the dark days. We come back to not just the sound concept of ‘total return’ but how to benefit from a growing income stream that leads to share price growth, making ‘total return’.
Investor failure
In 2007 the quality of good companies was sound and measurable, but even those share prices tumbled alongside most markets, Why? Share owners found the need to liquidate portfolios to cover cash gaps elsewhere. Leveraged markets came under the most pressure as bank loans became harder to keep and prices fell across the board forcing more liquidation. Prime asset such as the housing markets were the focal point of price collapses. Bear in mind the replacement costs of those houses did not fall. All these prices fell because of investor failure brought on by credit failure, not because value fell away from good companies. And such investor failure and potential investor failure has not gone away. Should we now lurch into a double-dip recession it will hammer values once again!
Please note that equities as a class of investment fell right across the board including gold shares after August 2007. The gold price was rising, but investors did not have the capacity to ensure gold mining share prices would rise. Yes, gold Exchange Traded Fund share prices rose alongside the gold price, but that was because there was no corporate risk between the gold price and those shares.
Shares that will survive such a winter and whose price will grow are out there and are in the gold market, at the right price.
Shares ‘for all seasons’ are out there
In short, good shares that should be in a portfolio have to pay for their keep. [We have our own favorites in the Gold Forecaster newsletter we issue on a weekly basis.] We will say now that that excludes a large number of sound, large companies that don’t put investor interests and requirements first. And it is those companies that do badly when winter sets in.
Gold mining equities ‘feel’ only the average gold price over its entire financial year. Yes, they tend to discount the gold price during that year, even ahead of the average gold price. Now that there will be a greater emphasis placed on dividend streams, only when a company decides its profit distribution policies at the end of its financial year will the investor taste any benefit. These can be greater than the gold price, as certain select gold mining company share prices can outrun the gold price. So the emphasis on choosing well cannot be stressed enough. It starts with defining just what you want from the gold share investment.
The benefits of gold bullion
In many investors’ minds gold bullion is the only investment in extreme times, because of its portability, un-printability, etc. It will be ‘the ultimate bubble’ in the days to come, as George Soros said recently. But there are several categories that gold bullion fits into before that.
- As a portfolio diversifier.
- As a ‘counter to swings’ in all currencies.
- As a corporate-risk free investment.
- As a thermometer-like measure of the state of the global economy.
- Bullion ‘feels’ the rise and fall in the gold price instantly.
In each of these roles it can serve investors well as seen since 1999. For those who amazingly cling to the idea that it gives no [income return] we point to its exceptional ‘total return’ in that period when it rose from around $275 to today’s $1,125.
Its one disadvantage is that it is vulnerable to government interference and confiscation. Gold miming companies are vulnerable to government nationalization and taxation. In rare situational cases gold bullion can escape such government interference. [Contact us direct for more information on this gold-authenticmoney@iafrica.com ]
Which shares and what qualities do the right gold shares have?
Subscribers only
2010 gold prices forecast. For Subscribers only. We are in the process of forecasting prices in 2010 in – Chinese retail demand – Indian retail demand – European retail and Institutional demand – U.S. retail demand – The Gold Price itself.
Gold Forecaster regularly covers all fundamental and Technical aspects of the gold price in the weekly newsletter. To subscribe, please visit www.GoldForecaster.com
In Global Watch – The Gold Forecaster, we present the global picture as it relates to gold and while synthesising these factors to forecast the gold price.
The price of gold is an amalgam of diverse and changing influences. From different world urrencies to jewellery, from investors to speculators, from the U.S. to India, from Australia to Canada, from South Africa to Asia, the gold price is of interest to all. It cannot be seen in isolation as a metal, but must be understood as a Global Thermometer measuring monetary, political, and economic stability.
These factors do not merely add up to the price but interact -in sometimes irregular ways- to produce the gold price. For example, rising prices often lead consequently to rising demand, as the appetite for the metal grows. Its price may rise in one currency and simultaneously fall in another. The price of gold reacts sensitively to the overall level of global stability.
It is our task in this letter to track these different features, giving you both the Technical Analysis and the Fundamental features impacting the gold price each week. It is our goal to help you to understand and profit from this market, wherever you are on this globe. We welcome any input or observations you may have, which contribute to the enhancement of this service.
-
I know Mike is a very solid investor and respect his opinions very much. So if he says pay attention to this or that - I will.
~ Dale G.
-
I've started managing my own investments so view Michael's site as a one-stop shop from which to get information and perspectives.
~ Dave E.
-
Michael offers easy reading, honest, common sense information that anyone can use in a practical manner.
~ der_al.
-
A sane voice in a scrambled investment world.
~ Ed R.
Inside Edge Pro Contributors

Greg Weldon

Josef Schachter

Tyler Bollhorn

Ryan Irvine

Paul Beattie

Martin Straith

Patrick Ceresna

Mark Leibovit

James Thorne

Victor Adair