
Daily Updates
This Gold Market update is going to be short and to the point for 2 reasons. One is that I am too busy writing up stocks for subscribers to devote much time to the world at large – they are being written up as fast as possible, for reasons that will become obvious as you read on. The other reason is that for the 1st time in many months, the situation is nice and clear, and doesn’t require a time wasting diatribe.
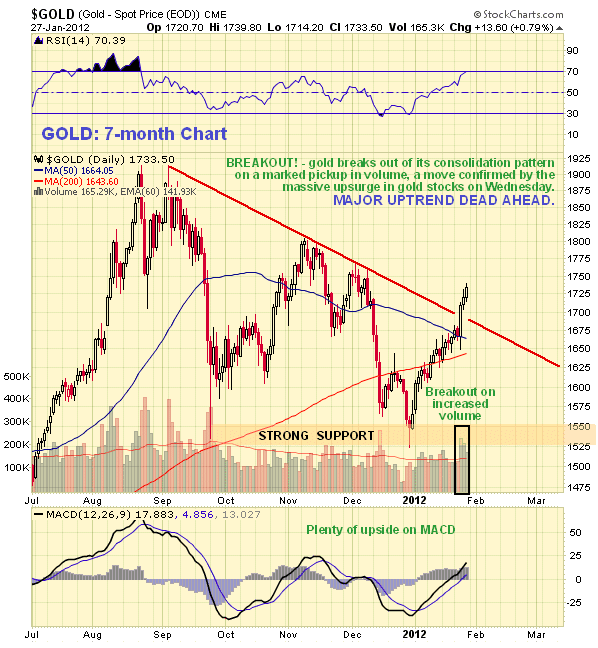
On the 7-month chart for gold we can see that on Wednesday it broke out from the consolidation pattern that it has been stuck in since it peaked last August-September. This was a strong move on significantly increased turnover, which is bullish, and was a move confirmed by a massive upblast by PM stocks. This breakout is therefore viewed as marking the end of what has turned out to be a period of consolidation, and the start of a major uptrend that should take gold MUCH higher – comfortably to new highs.
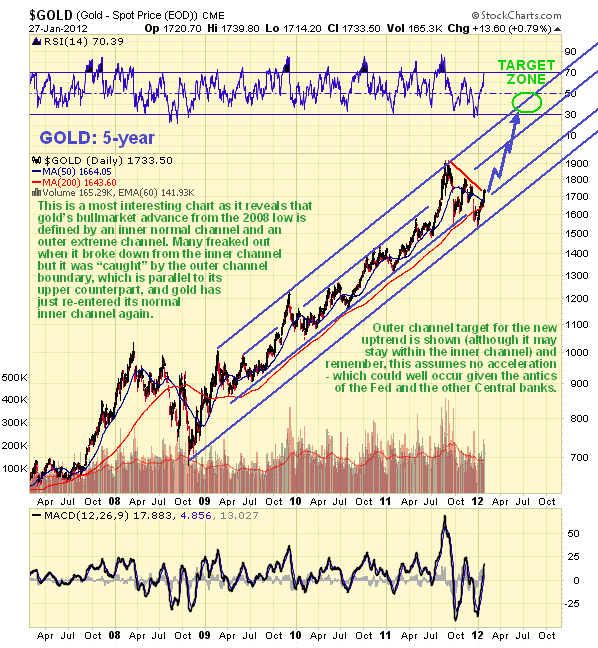
The 5-year chart for gold is most interesting as it reveals that its bullmarket advance from the 2008 low is defined by an inner normal channel, and an outer extreme one. As we can see, the recent recovery from the December lows has defined the lower boundary of the outer channel for the 1st time, and it is interesting to observe how the already defined upper channel boundary could have been used to predict the exact low in gold at its recent bottom. Not only has this parallel outer boundary held, but with last week’s breakout, the price has regained a foothold back within the inner channel this past week, and now, having broken out from its downchannel in force from September, it is in position to advance towards the upper channels boundaries again. The target zone given assumes that it will make a run at the outer channel boudary again – but it may instead be content to advance within the confines of the inner channel, which will still result in new highs and very worthwhile gains from here.
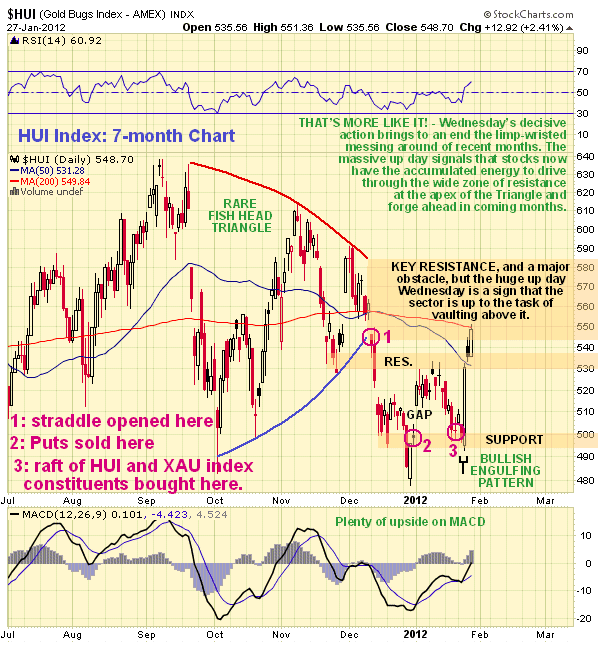
Although PM stocks have not yet broken out – to do that they will have to rise clear above the broad zone of resistance at the apex of the Fish Head Triangle in the indices that they broke down from in December, shown on the 7-month chart for the HUI index shown below – the massive up day on Wednesday is a sign that they have gathered the strength to do just that, and the fact that this up day occurred as gold broke out upside is of course no coincidence.
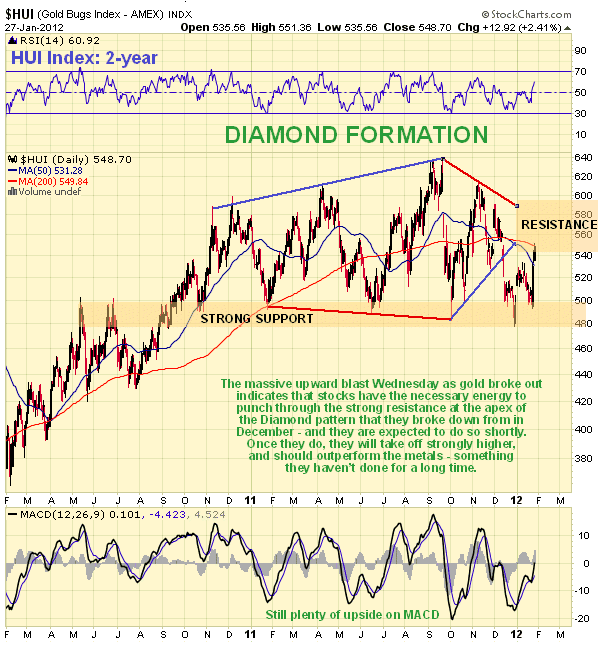
The Fish Head Triangle makes up the final stages of a large Diamond pattern that can be seen to advantage on the 2-year chart for the HUI index (it is also evident on the GDX chart). Diamond patterns are normally, although not always, bearish, which is a big reason why we were wary earlier, but in this modern age of market manipulation and meddling, politicians are not prepared to give the forces of capitalism free rein to do their necessary work of straightening out distortions, since that conflicts with their agenda. Thus, instead of letting European banks collapse, the Fed has decided to rescue them with “back door” QE dressed up as swaps etc – the reason is, as you might expect, not altruistic – if the European banks collapse, they will drag down the US banks, and as the US banks are the Fed’s masters and the bosses of the entire system, that cannot be allowed to happen, whatever the cost elsewhere. That is why the markets are rallying again across a broad front and why the outlook for gold and silver, and commodities generally, is once again bright, for the European bailout means money creation – and inflation.
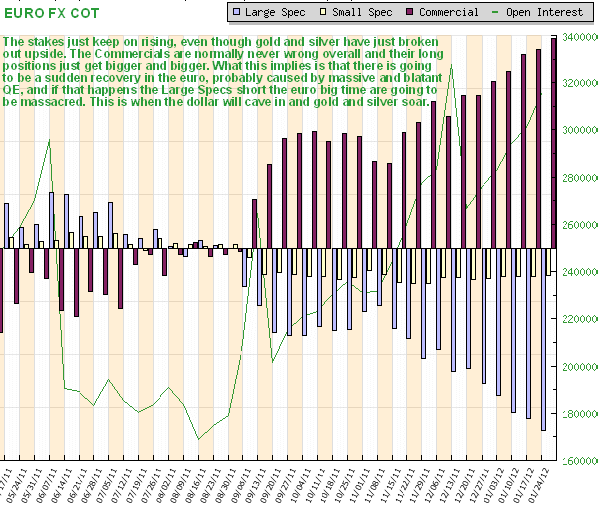
The breakouts in gold and silver are bad news for the dollar – and that implies a recovery in the euro. Thus it is interesting to observe that a lot of market players are still gambling on an all-out collapse by the euro, if the latest COT chart for the euro fx, shown below, is anything to go by. One thing is for sure, it isn’t the Commercials gambling on a collapse in the euro – just the opposite, so once again it looks like the hapless Large Specs have set themselves up to be royally fleeced. This COT chart looks like the final stages of a big tuna hunt where the nets are pulled together and the catch is finally hauled aboard.
Conclusion – a major uptrend is just starting in gold, gold ETFs and Precious Metals stocks. Good time to buy if you haven’t already
By Clive Maund
CliveMaund.com
For billing & subscription questions: subscriptions@clivemaund.com
© 2012 Clive Maund – The above represents the opinion and analysis of Mr. Maund, based on data available to him, at the time of writing. Mr. Maunds opinions are his own, and are not a recommendation or an offer to buy or sell securities. No responsibility can be accepted for losses that may result as a consequence of trading on the basis of this analysis.
Mr. Maund is an independent analyst who receives no compensation of any kind from any groups, individuals or corporations mentioned in his reports. As trading and investing in any financial markets may involve serious risk of loss, Mr. Maund recommends that you consult with a qualified investment advisor, one licensed by appropriate regulatory agencies in your legal jurisdiction and do your own due diligence and research when making any kind of a transaction with financial ramifications.
Perhaps the biggest dirty little secret has been the practice of salting the landscape with Analytical Shills. These are people who pose as independent analysts, but are underwritten by the crafty market manipulators. In 2003, Ten of Nation’s Top Investment Firms settled an SEC Enforcement Action involving obvious Conflicts of Interest Between Research and Investment Banking. Naturally the SEC did more to cover up the practice than anything else. The firms paid ONLY a penalty of $487.5 million, Disgorgement of $387.5 million, payments of $432.5 million to Fund Independent Research, and Payments of $80 million to Fund Investor Education. The firms never had to admit to anything and private suits were dismissed by Judge Pollack in New York saying the investors should have known they were taking risk.
Market Buzz – TFSA or RRSP? That is the Question.
With the start of a new year and the RRSP contribution deadline date approaching (Feb 29th) many Canadians are looking at their investment accounts and wondering what to do. The question that puzzles many an investor is whether or not they should contribute to their Registered Retirement Savings Account (RRSP) or their Tax Free Saving Account (TFSA). In an ideal world one might take the simple road of contributing the maximum amount to both accounts but in the real world of scare resources more complex decisions must often be made.
Before we move into our comparison, it is probably best to make sure everyone is up to speed on how each of these vehicles work. The RRSP is a tax deferred account. Essentially any Canadian can contribute a maximum of either 18% of their annual income or $22,450 to their RRSP on an annual basis. The government then allows you write this contribution off against your taxable income for that year. So an investor that contributes $10,000 to their RRSP and has a marginal tax rate of 40% would be credited approximately $4,000 on that year’s tax refund ($10,000 x 40%). As long as your money remains in your RRSP you can continue to generate returns on a tax deferred basis. We say tax deferred because any capital withdrawn from your RRSP will be added to your taxable income for that year.
The TFSA is what we refer to have a tax free account. Any Canadian, over the age of 18, is permitted to contribute $5,000 per year to their TFSA. The money can be put into a wide variety of eligible investments, including stocks, bonds, and in some cases, even private companies. Unlike the RRSP, an investor cannot use their TFSA contribution to reduce their taxable income for the year. However, any money contributed to the TFSA can continue to generate returns indefinitely, which are completely tax free. Even when you withdraw your money from the TFSA you still don’t pay tax.
The best way to understand the two accounts is to use an example. Let’s take two investors, Mary and Sam. Each of these investors is in a marginal tax rate of 40%, and each wishes to contribute $10,000 in pre-tax income to a registered account (Mary to the RRSP and Sam to the TFSA). Because Mary is contributing to here RRSP she can contribute the entire $10,000 and not have to worry about the tax (at least for now). Sam on the other hand has to pay the taxman and is left with $6,000 ($10,000 x (1 – 40%)) to put in his TFSA. So Mary starts off with $10,000 and Sam starts off with $6,000. Over the next 15 years (assuming no additional contributions) both investors generate an average annual return of 6%, so at the end of the period Mary’s RRSP is worth $23,965 and Sam’s TFSA is worth $14,379. It would appear at first sight that the RRSP won the battle of long-term returns; however, look at what happens when both Mary and Sam decide to withdraw the money from their accounts. Sam already paid his tax before he made the contribution and the returns accrued tax free. When he withdraws his money he receives the entire $14,379. Mary on the other hand did not pay tax on the initial contribution but is taxed on withdraw. Assuming that her marginal tax rate is still 40% she would receive net cash of $14,379 ($23,965 x (1 – 40%)). This happens to be exactly the same as what Sam received.
What this example is intended to illustrate is that the value of RRSP relative to the TFSA is primarily a function of the difference between your tax rate when you make the contribution and your tax rate when you withdraw the funds. Think of it this way…with the RRSP you pay the tax on withdraw whereas with the TFSA you pay the tax at contribution. If your tax rate is going to be lower at withdraw then at contribution, the RRSP is the best vehicle. If your tax rate is lower today (at contribution) then it will be when you withdraw the funds, the TFSA is the best vehicle. The RRSP is intended to be used for old age and one might think that your income (and likely tax rate) will be lower at retirement than in your prime earning years. This is not an unreasonable conclusion but it will not apply to all situations. If for example an individual were to be making low income in a particular year as a result of unemployment, underemployment, maternity leave, leave of absence, health issues, etc, then the tax rate could actually be higher in retirement making the TFSA the more suitable choice. There is also the possibility that funds may have to be withdrawn before retirement as a result of emergency or even business opportunity. While it is rarely advisable to withdraw funds from an RRSP before retirement is does happen on occasion.
One factor that is rarely discussed but important to consider is how your RRSP or TFSA will impact your eligibility for senior benefits in retirement. Seniors earning annual income over a certain threshold will in fact not be eligible for some government sponsored benefits in retirement. Capital withdrawn from the RRSP will impact senior eligibility for many of these benefits but investment returns and capital withdrawn from the TFSA will not.
Conclusion
Unfortunately there is no easy answer between the choice of RRSP or TFSA. The suitability of each vehicle depends primarily on the difference between the individual investor’s tax rates when they make the contribution compared to the tax rate when they withdraw the capital. If the tax rate is higher at contribution then the RRSP is likely the superior vehicle. If the tax rate is higher at withdraw then the TFSA is likely the superior vehicle. Of course, none of us is able to say what our tax rate is going to be in the next 10, 15, or 20 years or how the government is going to change the rules applied to these two registered accounts. This makes it pretty much impossible to determine with certainty which account is the better options. Rather than stress too much about it the most important thing is that individuals are saving money for retirement and making use of these tax advantaged accounts. Each individual investor can either choose one of the two accounts into which to make their annual contribution or they can split their total annual contribution equally (to the extent that contribution limits will allow) between the two options. Using either one is almost always better than not using them at all.
Put It To Us?
Q. If I own stock in a company that goes bankrupt, what do I get?
– Trent Alexander; Edmonton, Alberta
A. Well, Trent, let’s start by taking a quick look at the pecking order. This refers to the levels of rights that come with the different classes of securities that a company issues, including mainly bonds, preferred stock, and common stock. As an owner, it may seem you should be first in the “asset line.” After all, you did pay for them. However, in the world of finance, the reality is quite the opposite. Common shareholders are at the very bottom of the corporate totem pole, kinda like the “vultures” that can move in only after the lions, hyenas, and wild dogs are done eating their share. If a company liquidates, bondholders get first crack at the leftovers, followed by preferred shareholders, and then you, the lowly common shareholder.
KeyStone’s Latest Reports Section
- Micro-Cap Oil Sands Service Company Trades at 4 Times Earnings and with Big Growth Opportunities in 2012 (New Buy Report)
- Technology – Software Company Reports Record 2011 Results, Q4 EPS Significantly Beats Street Estimates (Flash Update)
- Oil & Gas Equipment Manufacturer Announces Tripling of Quarterly Dividend (Yield Now 4%) (Flash Update)
- Contract Drilling Company, Low Valuations (5.5 times EPS), Strong Growth, Strong Rig Growth – Initiating Coverage with SPEC BUY (Focus BUY) (New Buy Report)
- Micro-Cap Oil Sands Service Company Trades at 4 Times Earnings and with Big Growth Opportunities in 2012 (New Buy Report)Technology – Software Company Reports Record 2011 Results, Q4 EPS Significantly Beats Street Estimates (Flash Update)Oil & Gas Equipment Manufacturer Announces Tripling of Quarterly Dividend (Yield Now 4%) (Flash Update)Contract Drilling Company, Low Valuations (5.5 times EPS), Strong Growth, Strong Rig Growth – Initiating Coverage with SPEC BUY (Focus BUY) (New Buy Report)Extrusion & Automotive Manufacturer Posts Solid 2012, Pays Strong Dividend (3.6%) & Looks for Growth in 2012 – Reiterate BUY (Flash Update)
Downside short term risk in equity markets currently exceeds short term upside potential. More sectors are starting to roll over from overbought levels. Fourth quarter earnings reports, economic news and possible macro events point to the high probability of at least a shallow, short term correction. Short term weakness will provide an opportunity to enter into seasonal plays that traditionally outperform during the spring season (e.g. Energy).
After the near-collapse of the financial system in 2008, a growing number of people have come to realize that our monetary disease is terminal. It is that group to whom I address this paper. I sincerely hope that this group includes leaders in business, finance, and government.
I do not believe that my proposal herein is necessarily “realistic” (i.e. pragmatic). There are many interest groups that may oppose it for various reasons, based on their short-sighted desire to try to continue the status quo yet a while longer. Nevertheless, I feel that I must write and publish this paper. To say nothing in the face of the greatest financial calamity would go against everything I believe.
-
I know Mike is a very solid investor and respect his opinions very much. So if he says pay attention to this or that - I will.
~ Dale G.
-
I've started managing my own investments so view Michael's site as a one-stop shop from which to get information and perspectives.
~ Dave E.
-
Michael offers easy reading, honest, common sense information that anyone can use in a practical manner.
~ der_al.
-
A sane voice in a scrambled investment world.
~ Ed R.
Inside Edge Pro Contributors

Greg Weldon

Josef Schachter

Tyler Bollhorn

Ryan Irvine

Paul Beattie

Martin Straith

Patrick Ceresna

Mark Leibovit

James Thorne

Victor Adair