
Daily Updates
They give us ice wine and Tim Hortons doughnuts. Now our neighbors to the north are providing something many Americans consider harder to find: a steady, conservative investment.
Tired of the turbulence in the global debt markets, American investors have been pouring into Canadian government bonds. Through October, investors bought $7 billion worth of the country’s sovereign bonds and government-backed debt, up 12% from the start of the year, to $67 billion, according to the most recent data available from fund tracker Morningstar and Ipreo, a market research firm.
All that excitement has even spurred a first: an all-Canada bond fund, launched this month by fund giant Pacific Investment Management Co.
At current rates, 10-year Canadian bonds are in line with Treasurys, at just above 2%. But fans say their allure is about more than yield in an environment where investors are fleeing European government bonds as the debt crisis drags on and some analysts are saying the United States is at risk of another credit downgrade. Given all that, Canada has emerged as one of the last true safe havens available to investors, says Ronald Deutsch, managing director of advisory firm Sage Capital Management.
Indeed, of the 15 countries that have retained their triple-A ratings by Standard & Poor’s, Canada has the fourth largest bond market behind the United Kingdom, Germany and France.
With its low inflation and modest debt, “Canada from a credit-quality perspective is the soundest ” of these top-rated countries, says Brendan Murphy, director and portfolio manager of global fixed income for Standish Asset Management Company.
Financial advisers also like Canadian government bonds for the diversification they provide against the dollar. The bonds are denominated in local currency, so if the Canadian dollar gets stronger against the greenback, the bonds end up worth more than the yields suggest, says Paul Christopher, chief international strategist for Wells Fargo Advisors.
Still, the growing popularity has already caused the payouts on Canadian bonds to shrink the 10-year bond yielded more than 3% less than a year ago, according to FactSet Research. (As bond prices rise, yields decrease.)
And the options for getting exposure to these bonds are limited. Investors who want to buy individual bonds must purchase them through their brokerage firm, which will shop around for sellers and negotiate a price; there is no equivalent of Treasurydirect.gov, where people can purchase Treasurys on their own. Investors typically must spend a minimum of $1,000, but experts say the bigger the purchase, the better the pricing.
For fund investors, analysts say the only pure play is the Pimco Canada Bond fund, which invests solely in government bonds.
Another strategy, says Peter Maris, a financial adviser in Wilmette, Ill., is to invest in a diversified foreign-bond fund with a sizable allocation to Canada. He likes the Loomis Sayles Global Bond fund, which has 8% of its assets in the country’s bonds.
Technical, fundamental and seasonal influences point to another volatile period for equity markets around the world this week. An opportunity to initiate/ add to positions will present itself when short term technical indicators start to recover. Preferred strategy is to prepare for an entry into economically sensitive sectors (particularly sectors that benefit from seasonal influences). For now, patience is a virtue. Ed Note: This comment by Mark Leibovit is also on Don Vialoux’s site this morning. You can visit the site HERE
Mark Leibovit’s Daily Gold Comment
More information on Mark’s services is available at
http://www.vrtrader.com/login/index.asp
GOLD – ACTION ALERT – NEUTRAL
Spot gold and silver are still holding last Monday’s lows (1665 and 30.59, respectively, but that may not last very long. I do not like what I’m seeing technically. As stated, risk in gold is to first 1600 and then back to the September 1531 low. There is even potential risk well under that level if panic atmosphere unfolds much as we saw at the end of 2008 when they literally threw the baby out with the bathwater. I hope I’m wrong and I hope volume flips back to the upside – possibly in conjunction with major efforts on the part of the aforementioned debt monetization by the European Central Bank and the Federal Reserve. I am currently posting a NEUTRAL reading on gold and silver, but have my finger on the SELL button. None of this changes my longer-term view, but I am a technical analyst as well as an overall market strategist. When storm clouds appear, we take cover and ask questions later. The gold and silver market have bitter enemies at the highest levels of world government. It is clear strength in gold and silver at this time would cast a deep and dark shadow over their credibility – much as it has done throughout history – something they really are not partial to tolerating. It’s truly a tragedy that despite great public relations efforts on the part of government, regulators and exchanges, we truly do not have a level playing field and free capital markets. Hopefully, I live along enough to see the rascals in government and thrown out and better, more honorable people like Ron Paul in their place. Bottom line: gold and silver and gold and silver mining shares are great long-term investments, but not necessarily at this moment. Caution is advised.
More at Don’s Technical Talk site HERE
Ed Note: Rogers is also maintaining Short Positions in Stock Markets around the World
Fence sitters of the silver market are forewarned: buy more silver. That advice, according to Jim Rogers of Rogers Holdings, is the heads-you-win-tails-you-win investment proposition in the years ahead.
Rogers has little doubt of more central bank intervention planned in the wake of a global economic slowdown, but if he’s off the mark, silver (and commodities, generally) investors will win anyway, as Asia’s production-export model gears to supply what the world needs—including lots of existing and new products containing silver.
“I’m long commodities and currencies, because if the world gets better, the shortages in commodities will make sure I make money,” the 69-year-old Rogers told CNBC. “If the world economy doesn’t get better, I’d rather own commodities because they’re [central banks] going to print money.”

Most stock market investors that I talk to are frustrated with the market. They have grown tired of looking at the dramatic up and downward moves in the value of their portfolio. Many tell me that they don’t even look at their statements any more. They know that they need to invest in the market to save for retirement but most wonder if investing in stocks is even worth it.
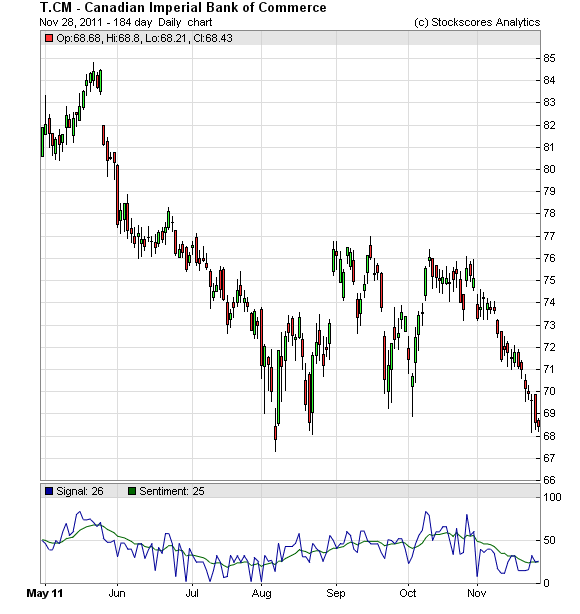
There are so many stocks that have not made any gains in weeks, months or even years. Walmart (WMT) is trading today at the same price it was trading at over 10 years ago. On Friday, CIBC (T.CM) closed at $68.43, the same price it traded at in 2005. It has been a frustrating decade for the buy and hold investor.
However, since 2005, CIBC has also traded above $105 and below $40. For the trader possessing some ability to time the market, there was a lot of opportunity to extract very good returns from stocks showing price volatility.
Consider the chart below of Goldcorp (NYSE: GG, TSX:T.G). Six months ago, the stock was at $53 (Canadian listing). On Friday, it closed just above $50. A $3 a share loss is what sitting on that stock for six month earned you. Probably a few grey hairs as well.

However, consider what the stock has done along the way. Five times it has fallen to $45 a share and bounced higher. Each of these bounces saw the stock move up between $4 and $10. If you bought the stock at $45.50 each time it hit and sold it once it hit $49 you would have made $17.50 a share over the past six months.
That is a 38% gain in half a year.
Most investors argue that timing the market is difficult and, without some basic chart reading skills, they are right. If you listen to headlines, you will usually avoid stocks when they should be bought and buy stocks when it is nearing the time when they should be sold. This is because investors tend to make investment decisions based on news headlines and the media tends to react to prices moves rather than predict them. The result is that the mood is usually negative after a stock has been falling in price and positive after a stock has been rising.
However, if you keep a few simple concepts in mind, you can time the market successfully. Remember:
Consider the last time T.G bottomed at around $45 and made a better than 20% gain in only a few weeks. Was this hard to predict? Well, if you look at the chart and keep in mind the concepts listed above, it really wasn’t.
In the middle of October, T.G had bounced four times near $45. I never like to buy at a floor just because it has been a place for price support in the past. However, if I see the market confirming something that should happen, like a bounce off of support that has held up for six months, then I will act.
It helps to be able to look at a shorter term time frame. This is why we have now added intraday charts to Stockscores.com. You can view stocks on any intraday time interval (1 minute, 14 minute, 37 minute, whatever you like) going back as far as 60 days. Here is a 30 day, 120 minute chart for T.G:

There was a good entry signal at the green arrow and a good sell signal at the red arrow. At the green arrow, the stock had broken a downward trend line after forming a rising bottom. This intraday chart interval confirmed what we expect to see happen based on the daily chart, giving the trader the opportunity to buy the stock at $46 a share.
The stock then went in to an upward trend marked by a series of rising bottoms. Those rising bottoms switched to falling tops just before the red arrow and then the upward trend line was broken. Time to sell at $53.50, earning a gain of $7.50 a share or 16% in about three weeks.
I know you would rather make 16% in three weeks than lose 6% in six months. Does it take a lot of work?
Certainly, it takes more work than giving your money to a manager and vowing to never look at the statements. However, if you can devote 15 minutes a day to your portfolio, you can do this.
Create a list of 10 stocks to watch. They should be a group of stocks that are not too correlated to one another and fairly actively traded so you can move in and out of them easily. Set up this watch list on Stockscores.com or Tradescores.com and make sure you look at the charts once each day. Watch for situations where the chart reading concepts described earlier provide a signal to make a trade. Most days you will not have anything to do. Once in a while, a trade will be obvious.
This is a volatile market that lacks a clear long term trend. For the buy and hold investor, that has made it a difficult and frustrating market. For the trader, the price volatility has meant opportunity. You just have to change your approach.

Stocks have been trending lower through November with strong selling pressure last week. That means the next trading opportunity will be on the bounce back as buyers step in to do some bargain hunting. We have not seen a signal for a bounce yet but that could happen this week.
With this in mind, I looked at the 100 most active stocks on the TSX using the free to use Chart Watch Tool on Tradescores.com. I was looking for stocks that have been falling recently but are now at or near a floor price on their charts.
Three stood out which should be watched on their intraday chart for a break of the downward trend line, preferably from a rising bottom. Consider the three stocks listed below and watch them for an entry signal to trade for a reversal:

1. T.CM
T.CM has a tendency to bounce off of $68 a share and is nearing that price now. Pull up an intraday chart and draw a line across the falling tops going back over the last 15 days. Consider buying the stock when it is able to break that downward trend line.
2. T.MFL
T.MFL has fallen from $18.50 to $11.50 in only two months but it made a good bounce off of $11.25 five months ago. Watch the 30 day, 60 minute chart on Stockscores.com for a break of the downward trend line.

3. T.SMF
$7 is support for T.SMF, the stock is nearing that price now. Monitor the 30 day, 60 minute chart for a break of the downward trend line and ride the stock higher so long as it does not fall back through support.

-
I know Mike is a very solid investor and respect his opinions very much. So if he says pay attention to this or that - I will.
~ Dale G.
-
I've started managing my own investments so view Michael's site as a one-stop shop from which to get information and perspectives.
~ Dave E.
-
Michael offers easy reading, honest, common sense information that anyone can use in a practical manner.
~ der_al.
-
A sane voice in a scrambled investment world.
~ Ed R.
Inside Edge Pro Contributors

Greg Weldon

Josef Schachter

Tyler Bollhorn

Ryan Irvine

Paul Beattie

Martin Straith

Patrick Ceresna

Mark Leibovit

James Thorne

Victor Adair