
Daily Updates

Here is an interesting observation: The value of the SPDR Gold Trust (GLD) is now worth more than the SPDR S&P 500 (SPY)
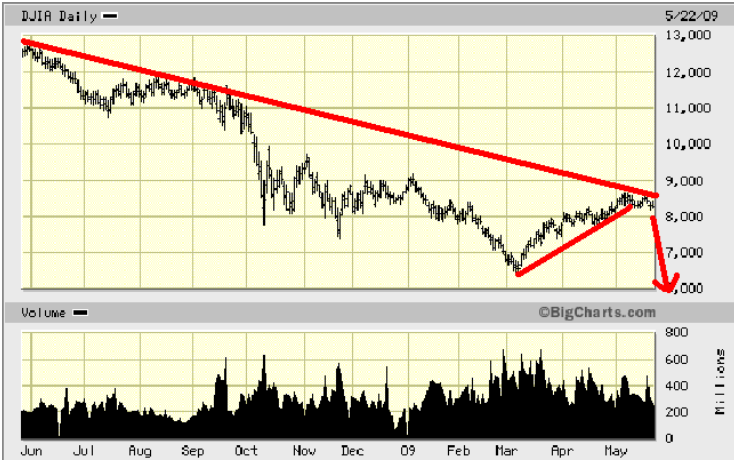
Last week Lowry’s Selling Pressure Index crossed ABOVE its Buying Power Index, a move that I consider bearish. Thus, the barometric needle has switched over to the bear side. In the past there have been manic periods like the one we have been going through. This switch in Selling Power to the dominant position, is an early warning, and I think it behooves all subscribers to sell their regular common stocks and move to the sidelines, thereby awaiting clearer signals as the market finally calms down. Richard Russell 08/22/11 Dow Theory Letters HERE to subscribe
Demographic Headwinds for US Stock Prices
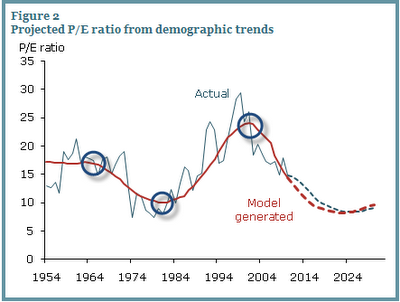
This evidence suggests that U.S. equity values are closely related to the age distribution of the population. Since demographic trends are largely predictable, we can forecast the path that the P/E ratio is likely to follow in the next few decades based on the predicted M/O ratio.
Figure 2 compares the actual and model-implied P/E ratios for the sample period ending in 2010. We calculate the path for the model-implied P/E during the sample period by feeding in actual M/O ratios. We call the long-run path of the P/E ratio predicted by the model the “potential P/E ratio” and designate it P/E*. Figure 2 shows that the P/E* (red dashed line) is highly correlated with actual P/E during the sample period.
Demographic Headwinds for US Stock Prices
….read more and view Charts HERE
Last week Lowry’s Selling Pressure Index crossed ABOVE its Buying Power Index, a move that I consider bearish. Thus, the barometric needle has switched over to the bear side. In the past there have been manic periods like the one we have been going through. This switch in Selling Power to the dominant position, is an early warning, and I think it behooves all subscribers to sell their regular common stocks and move to the sidelines, thereby awaiting clearer signals as the market finally calms down. Richard Russell 08/22/11 Dow Theory Letters HERE to subscribe
Demographic Headwinds for US Stock Prices
This evidence suggests that U.S. equity values are closely related to the age distribution of the population. Since demographic trends are largely predictable, we can forecast the path that the P/E ratio is likely to follow in the next few decades based on the predicted M/O ratio.
Figure 2 compares the actual and model-implied P/E ratios for the sample period ending in 2010. We calculate the path for the model-implied P/E during the sample period by feeding in actual M/O ratios. We call the long-run path of the P/E ratio predicted by the model the “potential P/E ratio” and designate it P/E*. Figure 2 shows that the P/E* (red dashed line) is highly correlated with actual P/E during the sample period.
….read more and view Charts HERE
In the last update, despite being extremely overbought, gold was expected to advance to even higher levels, for various reasons, principally the COT readings and the bullish volume pattern. We gave a target in the $1900 area, and that target was very nearly attained on Friday when gold hit $1881 intraday, before reacting back to close well well off its day’s highs.
Gold is now monstrously overbought and has finally caught the attention of the mainstream media who are all over it. These factors alone are regarded as making the probably of it reversing soon very high, and if we look at the charts we can see good reasons why it should react back shortly.
On all its short and medium-term oscillators gold is now horrendously overbought. We can see that on our 6-month chart with gold now super critically overbought on its short-term RSI, with it having been critically overbought all this month to date on this indicator. Meanwhile on its more medium-term MACD indicator it is now massively overbought – these conditions being reminiscent of silver late in April. In addition it has opened up a now huge gap with its moving averages.
….view chart and further commentary HERE
-
I know Mike is a very solid investor and respect his opinions very much. So if he says pay attention to this or that - I will.
~ Dale G.
-
I've started managing my own investments so view Michael's site as a one-stop shop from which to get information and perspectives.
~ Dave E.
-
Michael offers easy reading, honest, common sense information that anyone can use in a practical manner.
~ der_al.
-
A sane voice in a scrambled investment world.
~ Ed R.
Inside Edge Pro Contributors

Greg Weldon

Josef Schachter

Tyler Bollhorn

Ryan Irvine

Paul Beattie

Martin Straith

Patrick Ceresna

Mark Leibovit

James Thorne

Victor Adair