
Daily Updates
Downside short term risk in equity markets currently exceeds short term upside potential. More sectors are starting to roll over from overbought levels. Fourth quarter earnings reports, economic news and possible macro events point to the high probability of at least a shallow, short term correction. Short term weakness will provide an opportunity to enter into seasonal plays that traditionally outperform during the spring season.
Over the past five months gold has fallen sharply and is no longer headline news which it once dominated back in 2011 when it was making new highs every day. The shiny metal has been under pressure because traders and investors started to pull some money off the table to lock in gains. Gold prices had surged so fast most advanced traders knew that final high volume surge was not sustainable. But the main reason gold topped out in my opinion was because the US Dollar index had put in a bottom and started to build a base. As we all know a rising dollar typically means lower stocks and commodity prices.
I have posted some charts below covering gold in detail using multiple time frames. The weekly which is long term, daily which is the intermediate trend and the 4 hour chart which shows gold momentum and intraday action. At the very bottom I talk about the US Dollar and what is happening with that.
Gold Weekly Long Term Trend Analysis
The weekly chart is not the most exciting time frame to follow as you will grow old watching it. That being said it is crucial for understanding the long term trend, price and volume analysis.
Below you can see that gold’s recent pullback has been a 3 wave correction, which is a normal pullback for any investment. But taking into account the rally from 2008 – 2011 I feel this pullback will have one more low put in before bottoming out. This would make for a 5 wave correction much like what happened in 2008.
Click HERE for Larger Charts

4 Hour Intraday Chart of Gold
The 4 hour chart of gold allows us to see all the intraday price action which would normally not be seen with a daily chart. It also gives us enough data to build our analysis upon.
My preferred setup for gold which I feel if happens will trigger major buying in the yellow metal. If/when we get a rally in gold would also likely mean some more economic uncertainty has entered the market either from within the USA, Europe or China…
Click HERE for Larger Charts

Weekly Dollar Index Long Term Analysis
The dollar has the potential to rally to the 87 – 88 level before putting in a major top. For this to happen we will need to see the Euro crumble (both currency and countries divide) in my opinion.
If you look at the weekly chart of gold and this chart of the dollar index you will notice that gold topped when the dollar bottomed. Over the past couple year’s gold and the dollar have had an inverse relationship to each other.
With all kinds of crap about to hit the fan overseas I think it’s very possible gold will rally with the dollar. Reason being there is way more people overseas who want to unload their euro’s and with all the negative talk and doubt with the US Dollar individuals will naturally want to buy more gold.
Click HERE for Larger Charts

Weekend Trend Trading Conclusion:
In short, I expect a bumpy ride for both stocks and commodities in the first quarter of 2012. With any luck gold will pull back into my price zone shaking the majority of short term traders out just before it bottoms. And we will be positioning ourselves for a strong rally buying into their panic selling.
To just touch base on the general stock market quickly. I have a very bearish outlook for stocks. If the dollar continues to rise it is very likely the stock market will fall into a bear market. So I am VERY cautious with stock at this time.
If you would like to receive my Weekly reports, updates and trading education videos each week join my free newsletter here: www.GoldAndOilGuy.com
Chris Vermeulen
![]()
When you think of the best run companies in the world, what names come to mind? Wal-Mart? Proctor and Gamble? Perhaps Apple? Think of the worst run companies and you might think of a company like Enron, which is now out of business because it was run so poorly.
What makes these large companies good or bad? If you believe the highly paid bankers of Wall Street, running a company well requires the best leadership. Of course, the best people also come at the highest price.
If we compare Wal-Mart, the world’s largest retailer and a model of incredible cost efficiency, with Enron, the once high flying energy firm that ultimately burned out on bad deals, we see that the price paid for leadership meant little. Wal-Mart executives, by Enron standards, are poorly paid. Enron sought the brightest and best and paid them very well. Wal-Mart grows their leadership internally and pays their highest earners with modest salaries. Enron went bankrupt despite their smart and talented people.
What is the difference, does money not buy quality?
With my very limited knowledge of either company, one thing that stands out to me is the difference in systems and processes that each employ. Every task that a Wal-Mart employee is clearly defined and modelled for success. Employees at Enron were allowed to sort of do what ever they thought would help the company succeed. A noble idea, but the lack of standards allowed for individual goals to take priority to the detriment of the company.
From this example, it seems that plan and process take precedence over talent. A disciplined, highly calculated and planned business is able to do well even though it may not have the smartest people running the business. Talent is over rated.
And so it goes for trading.
I have taught aspiring traders from every possible background. The well educated and the drop outs, Mensa level IQs and those who might be referred to as not the brightest bulb on the tree. I have taught those who have already achieved financial success and those who are in pursuit of that dream.
And what stands out, after teaching a few thousand people, is that there is nothing about a person’s background that predicts trading success. When trading, anyone can succeed or fail.
So what does matter? At the very top of my list would be process. Having a detailed, well tested and constructed plan for making money in the market is a must. Every aspect of the plan must be well thought out and based on experience. The more steps in the trader’s plan that are left to human judgement, the greater the chance that the plan will achieve a poor result.
With a good plan, can anyone get the job done? If you ask Wal-Mart, the answer is probably yes. They hire thousands of people to do the various jobs that they employ and could not possibly expect that talent will allow each employee to get the job done. Their people succeed because their jobs are well defined.
What is important is how the tasks are defined. Wal-Mart succeeds in part because they have so much retailing experience. Their employees and management use their experience and resources to develop the very best processes. With those processes, even people who lack experience or talent are able to succeed.
This is exactly how it works for traders. I have seen so many successful and bright people fail in the stock market simply because they did not have the experience to develop the right plan.
Think about what you do in your career. Is your job hard?
Most people would answer no to this question since doing their job is what they are experts at. To the surgeon who has performed 1000 surgeries, the 1001st surgery is not particularly difficult. For the person who has never done one, it is a great and dangerous challenge, no matter how smart they are.
Does this mean that anyone can succeed as a trader if given a good trading plan? No, at least no better than anyone could succeed at removing your wisdom teeth if given a step by step process for doing it. You still need to practice the plan before you can achieve success.
Having a planned process helps us shorten the time it takes to learn something. The Wal-Mart employee or the surgeon can each do their job well by combining a good plan with some time for practice. The Enron employee might have had better success if they had a good plan to work from.
If you do not have a trading plan, stop trading. You might argue that you have done really well in the market over the past couple of months and you therefore do not need a plan. I would respond with some of the examples of people who gave back all their profits and more when the stock market was not working in their favour. A trending market can make the inexperienced look like they know what they are doing.
You can either create your own plan or you can buy one from someone who has put in the time to create a good one. I think that everyone should try to create their own plan because you learn a lot by doing so but, in the interest of time and money, buying a plan is a pretty good investment and a cheaper way to find success.
Your plan must be written down. It must be tested. It must be practiced. All trading plans should evolve with the market and as you gain experience. They need not be complex, simplicity in a plan usually works best. Plan the trade and trade the plan.
![]()
I have some concerns about the market going lower next week, there has been a pick up in fear recently as the VXX has broken its downward trend line. The SPY also broke its intraday upward trend line that has been in place since December 20th. The signs are not yet critical but I do suggest some short term caution as the market is due for some profit taking after the Santa Claus rally.
Individual stocks can still do well if they have good stories, we are seeing stocks starting to trade with less correlation to the overall market.
I ran the Stockscores Simple Market Scan this week and found a couple of stocks that look pretty good:
![]()
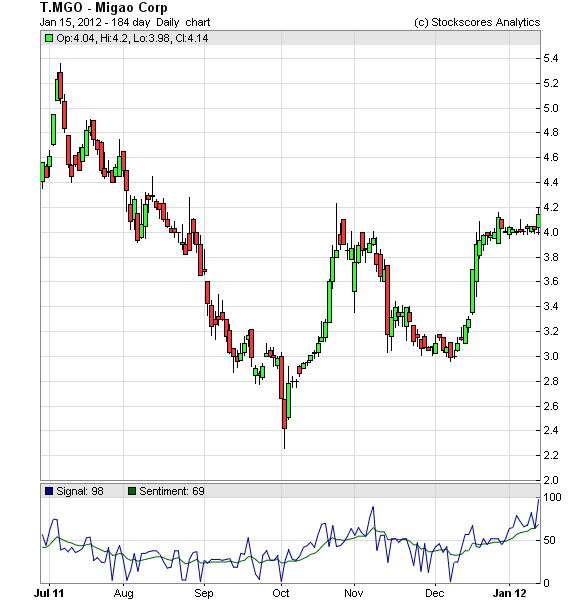
1. T.MGO
T.MGO is interesting, the stock had some big trades made on Thursday and then came to life late in the day on Friday. That tells me that something is going on and the pattern confirms it. The stock is moving through resistance from a cup and handle pattern. Support at $3.95.
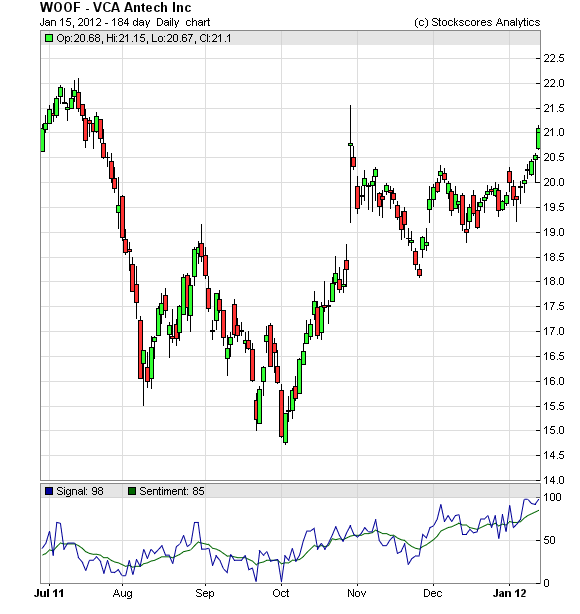
2. WOOF
WOOF is breaking out from an ascending triangle pattern with higher than normal volume on Friday, the stock appears likely to continue its upward trend. This is not a fast moving stock, upside potential is to resistance at $25. Support at $20.
References
- Get the Stockscore on any of over 20,000 North American stocks.
- Background on the theories used by Stockscores.
- Strategies that can help you find new opportunities.
- Scan the market using extensive filter criteria.
- Build a portfolio of stocks and view a slide show of their charts.
- See which sectors are leading the market, and their components.
Disclaimer
This is not an investment advisory, and should not be used to make investment decisions. Information in Stockscores Perspectives is often opinionated and should be considered for information purposes only. No stock exchange anywhere has approved or disapproved of the information contained herein. There is no express or implied solicitation to buy or sell securities. The writers and editors of Perspectives may have positions in the stocks discussed above and may trade in the stocks mentioned. Don’t consider buying or selling any stock without conducting your own due diligence.
Market Buzz – Credit Markets Continue to Heat Up in Canada as Europe Gets Hit with Credit Downgrades
On January 13th, the markets closed out their ninth trading day since the start of the New Year with early optimism giving way to realism. The TSX closed the week at 12,231 points up 42 points, or 0.35%, since the open of market on Monday. Markets throughout North America seemed to follow a similar pattern with both the S&P 500 and Dow Jones Average trading roughly flat for the week after robust gains last week.
Augmenting concerns of a housing bubble in Canada was BMOs announcement, stating that they would be reducing their 5 year fixed rate to 2.99%. This sparked TD to do the same and we suspect the remaining banks will soon follow suit. Canada’s real estate sector has been both a source of strength and concern as the country muddles its way through the current economic environment. The Economist recently published research (economist.com-article) on real estate values from 20 of the world’s most important economies relative to their national incomes and rents. According to the research, Canada’s housing market is 71% overvalued relative to rental income, giving it the unfortunate position of first place amongst the 20 country group. Relative to national income, we fared somewhat better at sixth place with the research indicating that on average, houses are 29% overvalued. I shudder to think of what the data would look like for Vancouver alone.
In Europe, Standard and Poor’s (S&P) cut credit ratings on nine countries, leaving Germany unchanged at triple-A for the time being. Both France and Austria lost their triple-A status with each country taking a one notch downgrade to double-A plus. Italy received a double notch downgrade to triple-B-plus from single-A and Spain was reduced to single-A from double-A-minus. Portugal, Cyprus, Slovakia, Slovenia, and Malta all also received downgrades. The issue with the lower credit rating is that it increases the costs of rolling over debt, placing more of a burden on fiscal and monetary policy at precisely the time that they need to free up capital to reduce their debt load. This is an ever deepening cycle that is the inevitable outcome for chronic debtors whether they are nations, corporations, or individuals. The best advice for the individual is to not let yourself enter into this cycle or to fight your way out if it has already started. After all…countries and corporations may be ‘too big to fail’ but we most certainly or not.
Looniversity – Consumer Confidence 101
If you’ve ever watched the markets with even a modest degree of interest, you’ve probably heard of the Consumer Confidence Index (CCI). Ever wonder what the heck it is? Let us put you at ease. In the U.S. (most widely quoted), the CCI is put out by the Consumer Confidence Board and is based on a survey that samples 5,000 households. The CCI is considered one of the most accurate indicators of confidence. It looks at factors including wages, interest rates, spending habits, and even goes as far as calculating the number of “help wanted” ads in newspapers to detect how tight the job market is.
The basic idea behind consumer confidence is that the better the consumers’ current and economic prospects appear, the more likely he/she is to spend and the more he/she spends, the better it is for the overall economy. Of course, the opposite is also true.
When evaluating the index, many people pay close attention to trends or the moving average over the past three to six months. Should the index move above or below the moving average, it is a good indication that consumer confidence is significant. Month-to-month changes are not considered to have as great an impact as the overall trend.
The CCI is watched closely by the U.S. Federal Reserve when determining interest rates, which affect stock prices. Lowering interest rates makes it easier to borrow, which ultimately supports consumer spending and higher confidence – something the stock markets get a warm and fuzzy feeling about.
Put It To Us?
Q. On BNN and CNBC, I keep hearing market gurus use the term “accumulation” or “accumulate” in what seems (to me at least) like different meanings. What’s up with that?
– Phil Walters; Edmonton, Alberta
A. Well Phil, like a massive snowball gaining momentum down a slope, the term accumulation seems to be “accumulating” more and more connotations within the financial arena – leaving the average investor “a snowball’s chance in hell” at understanding its true meaning. Okay, this may be stretching it a little, but its varied usage can be confusing.
There are three basic references to accumulation in the investment world.
1. In the context of corporate finance, it refers to profits that are added to the capital base of the company rather than paid out as dividends.
2. In the context of investments, it refers to the purchase by an institutional broker (or big investor) of a large number of shares in a company over a period of time in order to avoid pushing the price up.
3. In the context of mutual funds, it refers to the regular investing of a fixed amount while reinvesting dividends and capital gains.
KeyStone’s Latest Reports Section
- Technology – Software Company Reports Record 2011 Results, Q4 EPS Significantly Beats Street Estimates (Flash Update)
- Oil & Gas Equipment Manufacturer Announces Tripling of Quarterly Dividend (Yield Now 4%) (Flash Update)
- Contract Drilling Company, Low Valuations (5.5 times EPS), Strong Growth, Strong Rig Growth – Initiating Coverage with SPEC BUY (Focus BUY) (New Buy Report)
- Extrusion & Automotive Manufacturer Posts Solid 2012, Pays Strong Dividend (3.6%) & Looks for Growth in 2012 – Reiterate BUY (Flash Update)
- Technology – Software Company Reports Record 2011 Results, Q4 EPS Significantly Beats Street Estimates (Flash Update) Oil & Gas Equipment Manufacturer Announces Tripling of Quarterly Dividend (Yield Now 4%) (Flash Update) Contract Drilling Company, Low Valuations (5.5 times EPS), Strong Growth, Strong Rig Growth – Initiating Coverage with SPEC BUY (Focus BUY) (New Buy Report) Extrusion & Automotive Manufacturer Posts Solid 2012, Pays Strong Dividend (3.6%) & Looks for Growth in 2012 – Reiterate BUY (Flash Update) Mining Company – Shares Halted Pending News (Impact Positive) (Flash Update)
All bull markets have similarities and all equity bull markets have strong similarities. They go through similar phases. Most bull markets start off slow and then build towards what we like to say is an acceleration into a bubble and potential mania. In last weeks editorial we noted how bull markets, prior to the bubble phase, tend to make major bottoms every three or so years. Yet, in looking at the present bull market in gold stocks and comparing it to the previous three equity bull markets (Technology, Japan and Gold Stocks) we find stronger and deeper similarities which confirms to us that the gold stocks are in the bull market of our time.
In examining these four bull markets we find that the typical secular bull market in equities follows a strong pattern. Most would assume that the bubble or mania phase is the strongest connection. While this is often the case its really the start of the bull market and middle phase that follow a textbook pattern. The first phase consists of a fairly strong rise over six or seven years while the second phase (through a correction or consolidation) consists of five or six years of no net progress. This sets the stage for the acceleration and eventual bubble phase.
The Nasdaq began its bull market in 1980 so its first phase ended with the historic stock market crash in 1987. The market rebounded fantastically through 1991 and 1992. However, it wasn’t until late 1992 that the market escaped a five year period of no net progress. Though not shown, it was 1995 when the market began to accelerate into its bubble.

Next we have the Nikkei which shows Japan’s historic bull market. Looking at historical data shows the bull market began in earnest in 1967. The first phase ended in 1973. From 1973 to 1978, the market made little progress. After 1978 things really began to takeoff.

In our next chart we show a rebalanced look at the current bull market (HUI in red) and the bull market from the 1960s and 1970s (BGMI in blue). The time scale is aligned to the BGMI. Note the distinct similarities between each other but also to the aforementioned Nasdaq and Japan.

First, note that each market made its initial major peak at virtually the same time, about seven plus years in. Second, each market endured a major correction though each was different in time and scale. The HUI recovered more quickly but has yet to break away from the initial high. The HUI hasn’t made much progress since 2006 while the BGMI did nothing from 1968-1973. The BGMI made its final low (late 1972) almost five months after its initial peak. It was at that point when the BGMI would surge over the next 18 months to a new high. If the HUI follows the same path and scale then it would make its final bottom within weeks and gain strongly until the fourth quarter of 2013.
From this point forward the three historical bull markets essentially accelerated course and endured one final correction before the mania. The corrections were (BGMI 1975-1976, Nasdaq 1994, Japan 1981-1982).
The only distinction to make is that the gold stocks (BGMI) didn’t have the kind of mania the other two bull markets had. Perhaps that is just because mining is such a difficult business or that speculators concentrated on junior companies, silver and silver miners. In other words, the mania was centered outside of the senior gold companies.
In any event, its important to share these similarities as it shows that the struggles in the gold stocks are right on par with previous bull markets. Nothing that has happened is out of the ordinary. In fact it is only following the pattern of equity bull markets. Combined with the low valuations and low ownership of gold stocks, this is some very powerful evidence of what lies ahead. If you ’d like professional guidance in riding this bull market and uncovering the winning companies then consider our premium service.
Good Luck!
By Jordan Roy-Byrne, CMT
Jordan@TheDailyGold.com
-
I know Mike is a very solid investor and respect his opinions very much. So if he says pay attention to this or that - I will.
~ Dale G.
-
I've started managing my own investments so view Michael's site as a one-stop shop from which to get information and perspectives.
~ Dave E.
-
Michael offers easy reading, honest, common sense information that anyone can use in a practical manner.
~ der_al.
-
A sane voice in a scrambled investment world.
~ Ed R.
Inside Edge Pro Contributors

Greg Weldon

Josef Schachter

Tyler Bollhorn

Ryan Irvine

Paul Beattie

Martin Straith

Patrick Ceresna

Mark Leibovit

James Thorne

Victor Adair