

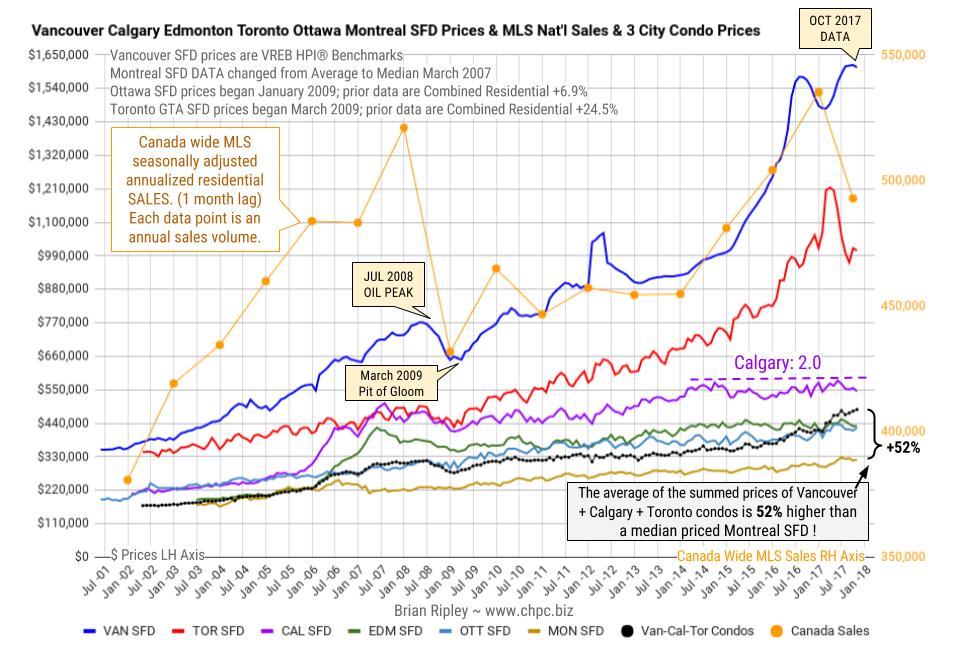
In October 2017 Toronto metro SFD prices hung on to their recent correction high but after 7 months since the March 2017 spike and peak price, they have lost $206,215 or 17%
(Plunge-O-Meter). Vancouver prices are still defying gravity; FOMO and speculative pricing is still on.
Anyone owning a detached house in the scorching hot Vancouver market is sitting on an unredeemed lottery ticket with time running out as buyers hibernate into the seasonal decline. The Bank of Canada interest rate up-moves is thinning the crowd even more.
….read more about Calgary & the CMHC
….also the plunge-0-meter:
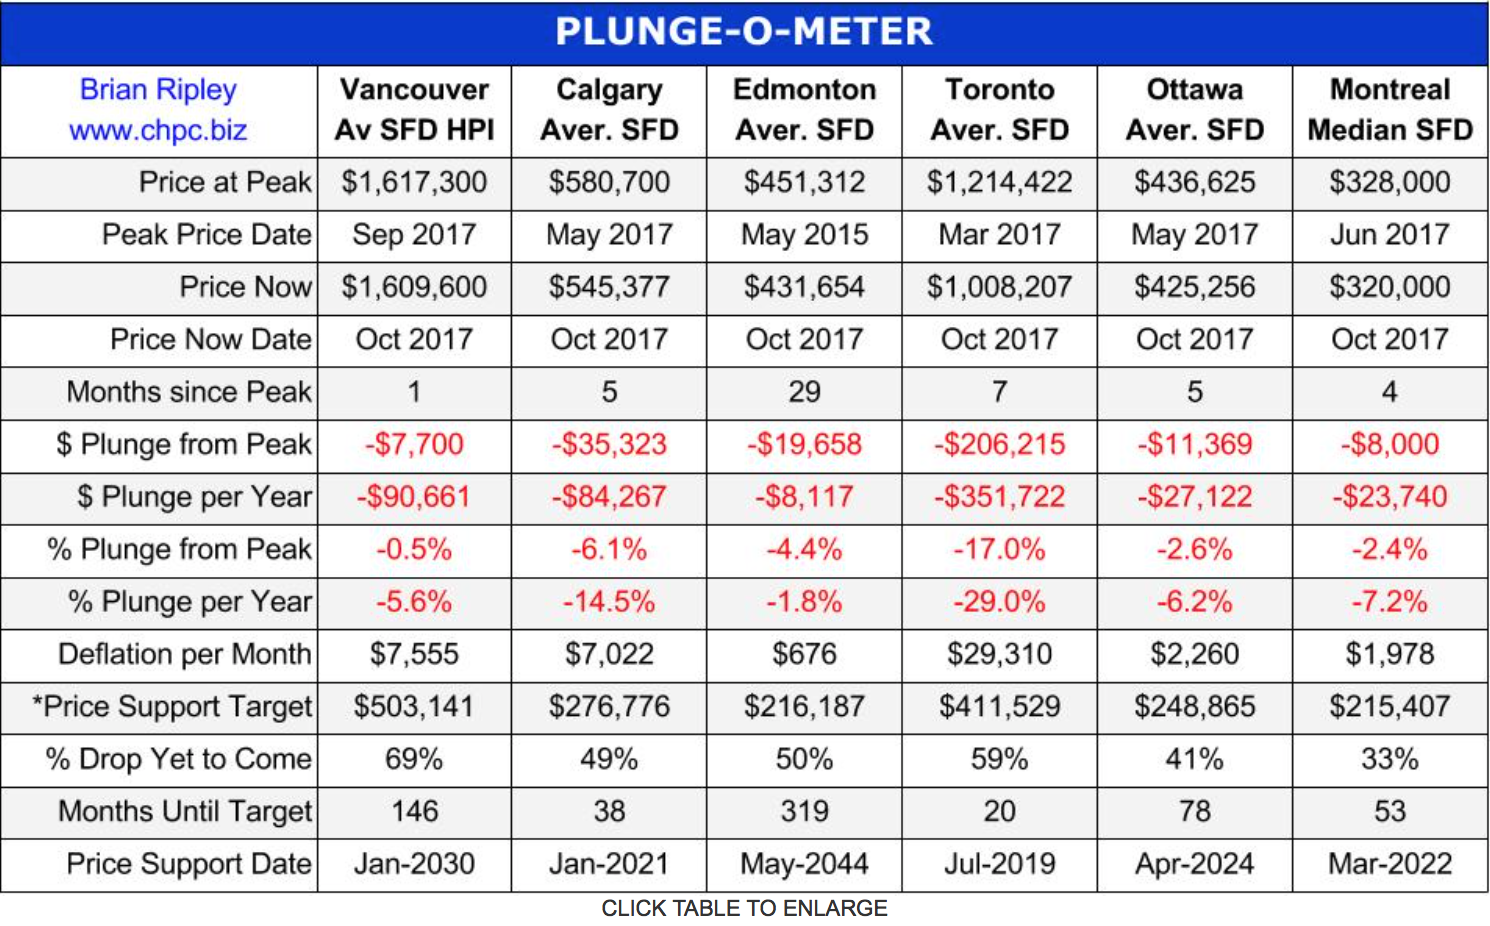
*The Price Support target represents prices at March 2005; the start of a 40 month period of ardent speculation in all commodities; then a full blown crash into the pit of gloom (March 2009); and then another 39 month rocket ship to the moon but then the crowd suddenly thinned out in April 2012. The revival of spirits erupted in 2013 as global money went short cash and long real estate on an inflation bet. Now we have a major sense of doubt about value in Toronto.
Plunge-O-Nomics
The Pit of Gloom
- ’07-’08 Average Vancouver SFD lost $122,900, or 15.9% in 8 months (2%/mo drop)
- ’07-’08 Average Calgary SFD lost $92,499, or 18.3% in 18 months (1%/mo drop)
- ’07-’08 Average Edmonton SFD lost $78,719, or 18.5% in 21 months (0.9%/mo drop)
- ’07-’08 Average Toronto SFD lost $63,867, or 13% in 13 months (1%/mo drop)
- ’07-’08 Average Ottawa Residence lost $25,664, or 8.6% in 6 months (1.4%/mo drop)
- ’07-’08 Median Montreal SFD lost $6,000, down 2.6% in 6 months (0.4%/mo drop)


